Cardano (ADA) Price Drops Again: Key Factors Behind the Downtrend
0
0

Cardano’s price has encountered another setback as it struggles to surpass the $0.40 mark. Currently trading below $0.3850, ADA shows signs of further losses in the near future.
Cardano Price Dips Again
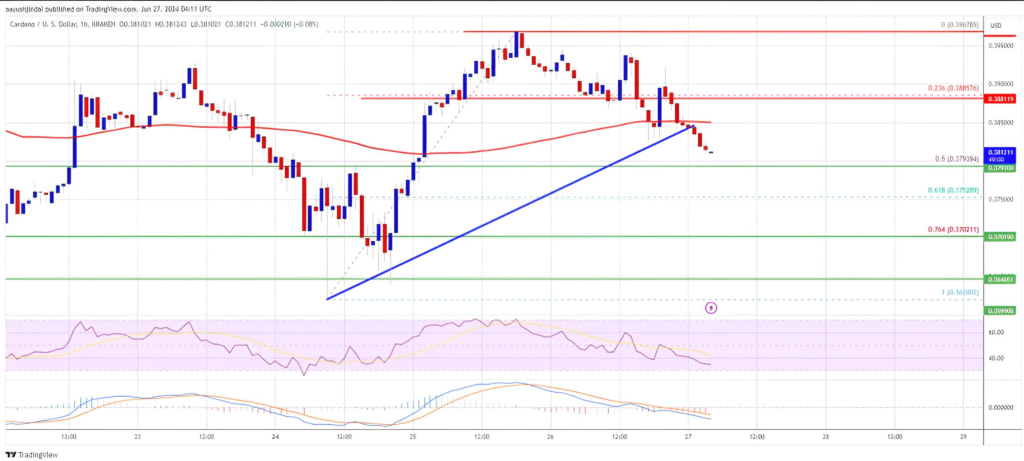
In recent days, Cardano experienced a recovery attempt similar to Bitcoin and Ethereum, pushing above the $0.3650 zone. However, the momentum was short-lived as ADA failed to break the $0.40 resistance. A high was recorded at $0.3967 before the price began a new downward trend.
The price drop saw ADA move below the $0.3880 and $0.3865 support levels. It also breached the 23.6% Fibonacci retracement level of the upward move from the $0.3620 low to the $0.3967 high. Additionally, a key bullish trend line with support at $0.3845 was broken on the hourly chart of the ADA/USD pair. This has resulted in ADA trading below $0.3850 and the 100-hourly simple moving average.

If ADA attempts another upward move, it is likely to face resistance near the $0.3850 zone. The first resistance level is at $0.3880, followed by the significant $0.40 mark. Successfully closing above $0.40 could initiate a robust rally, potentially driving the price towards the $0.4150 region and possibly further to $0.4250.
Potential for Further Declines
Should Cardano fail to surpass the $0.3850 resistance level, the downward trend could persist. Immediate support on the downside lies near the $0.3795 level or the 50% Fibonacci retracement level from the $0.3620 low to the $0.3967 high. The next major support is at $0.370. A break below this level could pave the way for a decline towards $0.350, with further support around $0.3350.
Technical Indicators
- Hourly MACD: The MACD for ADA/USD is gaining momentum in the bearish zone.
- Hourly RSI (Relative Strength Index): The RSI for ADA/USD is now below the 50 level, indicating bearish momentum.
Conclusion
Cardano’s price faces significant resistance and support levels that will determine its near-term direction. With the current bearish indicators, ADA could continue its decline unless it manages to break above key resistance levels.
Also Read: Ripple (XRP) vs. Cardano (ADA): Which Cryptocurrency Will Lead the Recovery Charge?
0
0


