
Why Did Cardano Just Jump 6%? ADA Eyes $0.50 Next

0
0
Something is stirring in the Cardano price prediction conversation this week, and traders who have been quietly watching ADA from the sidelines are suddenly paying very close attention.
A daily candle just closed in a way that has flipped the mood in the charts almost overnight, and the timing could not be more interesting, with Cardano also stepping into the spotlight over a major treasury funding decision that touches every corner of the ecosystem.
Whether ADA can actually turn this momentum into a sustained Cardano price forecast worth trusting is exactly what we are digging into below.
This is a purely technical and data-driven read of the Cardano chart and the current market setup. It reflects no personal position in ADA and should not be treated as financial advice.
Cardano Price Today: Live Data
ADA is currently trading at 0.2269, up 6.23% over the past 24 hours. Futures volume stands at 716.23 million dollars while spot volume sits at 154.56 million dollars, showing that a large share of this move is being driven by leveraged positioning rather than pure spot demand.
Market cap is holding at 8.33 billion dollars with open interest at 509.03 million dollars.
Circulating supply is 36.75 billion ADA against a total supply of 44.99 billion and a max supply of 45.00 billion, meaning the vast majority of ADA that will ever exist is already in circulation.
Source: CoinGlass, September 19, 2026.
Cardano News Today
The bigger story around Cardano news today has nothing to do with candles and everything to do with governance. 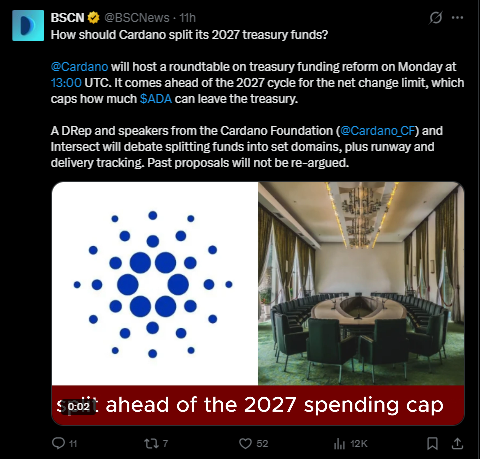
The Cardano Foundation is hosting a roundtable on Monday at 13:00 UTC focused entirely on how the network should split its 2027 treasury funds.
This discussion comes directly ahead of the 2027 cycle for the net change limit, the rule that caps how much ADA is allowed to leave the treasury in a given period.
A DRep, along with speakers from the Cardano Foundation and Intersect, is expected to debate splitting the funds into set domains, alongside how runway and delivery tracking will be handled going forward.
Notably, past proposals will not be reargued in this session, suggesting the ecosystem is trying to move forward rather than revisit old ground.
This kind of structural decision-making around treasury allocation is exactly the type of Cardano trend analysis fundamental holders should be tracking, since it directly shapes how much capital is available for future development. Source: BSCN on X, September 19, 2026.
Quick Take
CMP: 0.2268 on the Binance ADA/USDT perpetual 1D chart
Bullish trigger: daily close above 0.2586 opens the door to 0.3134 and 0.5016
Bearish trigger: daily close below 0.1901 shifts focus to 0.1709
Data timestamp: chart and market data as of September 19, 2026, 18:36 IST
Risk note: this move is running on strong futures volume, so leverage-driven volatility in either direction should be expected
Cardano Technical Forecast
Look at the 1D Cardano chart on Binance, and the story becomes fairly clear. ADA had been grinding lower under a persistent descending trendline for weeks, the kind of pattern that slowly drains confidence out of a market. 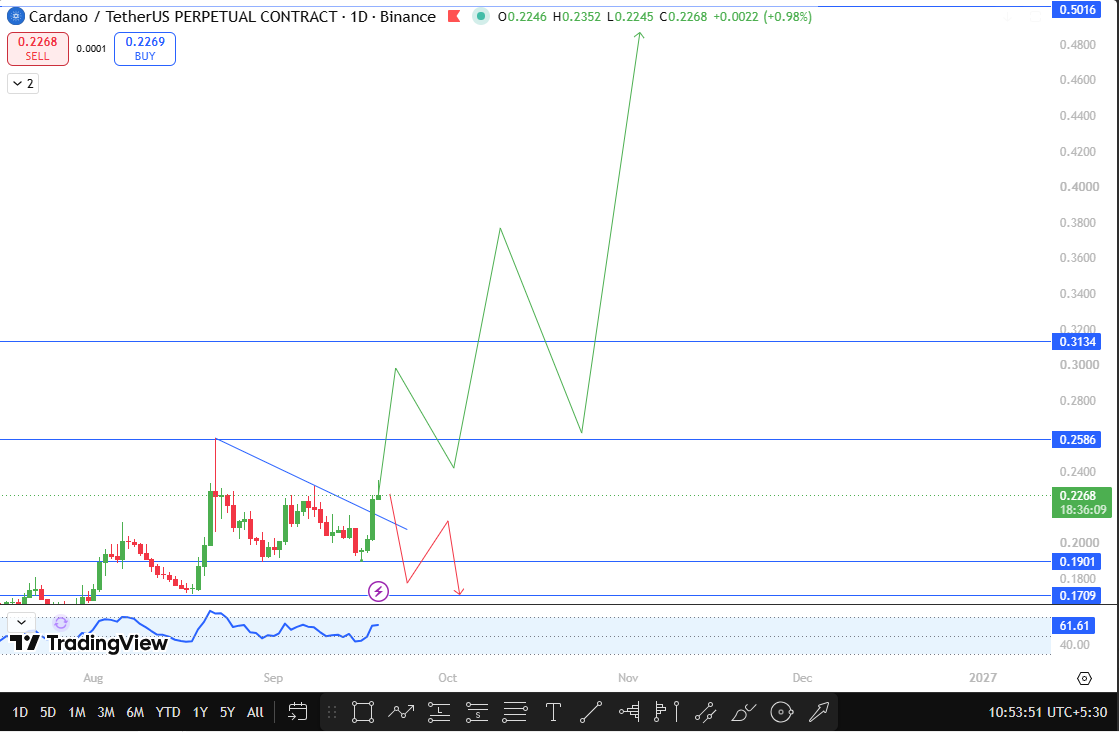
That changed with a decisive daily candle that not only pierced through the trendline but actually closed above it, which is the detail that matters most here.
A break without a close is often just noise, but a close above a multi-week trendline tends to carry real weight because it shows buyers were willing to defend the level into the close rather than let sellers fade it back down.
Right now the price is sitting at 0.2268, and the momentum reading on the chart shows an RSI of 61.61, comfortably in bullish territory without yet flashing overbought warning signs.
That leaves some room for continuation before momentum traders would start expecting exhaustion. The immediate battle zone ahead is the 0.2586 level.
This is not just a random number; it lines up as the next meaningful resistance shelf on the daily chart, and a sustained close above it would essentially confirm that the trendline breakout has real follow-through rather than being a quick spike that fades.
If ADA does manage that close above 0.2586 and holds it, the path opens toward 0.3134, which represents a much larger structural target, rebuilding confidence toward the higher end of ADA's recent range.
Beyond that, the more ambitious Cardano price prediction target sits at 0.5016, a level that would mark a dramatic recovery from where ADA has spent much of this cycle.
Reaching that zone would likely take sustained buying pressure over multiple weeks rather than a single burst of momentum, so it belongs firmly in the longer horizon part of this Cardano technical analysis rather than something traders should expect within days.
On the flip side, this breakout narrative only holds as long as 0.1901 stays protected. That level is functioning as the line in the sand for this entire bullish case.
A daily close below it would suggest the trendline breakout was a false move, and from there the next support that buyers would likely lean on is 0.1709.
Support and Resistance Levels
Level Type | Price | Distance from CMP (0.2268) |
Resistance 3 | 0.5016 | +121.2% |
Resistance 2 | 0.3134 | +38.2% |
Resistance 1 | 0.2586 | +14.0% |
Current Price | 0.2268 | — |
Support 1 | 0.1901 | -16.2% |
Support 2 | 0.1709 | -24.6% |
Bull, Base, and Bear Scenarios
In the bullish scenario, ADA holds above the reclaimed trendline and grinds its way up to test 0.2586 within the coming sessions.
A clean daily close above that shelf would likely draw in fresh momentum buyers who had been waiting on the sidelines for confirmation, and from there 0.3134 becomes a realistic near-term magnet, with 0.5016 sitting as the reward for patient holders further down the road.
The base case looks a little messier, and honestly this is probably the most likely outcome in the short run.
ADA spends the next several sessions chopping between the reclaimed trendline support and the 0.2586 resistance shelf, testing both sides as the market digests both the technical breakout and the treasury governance news together.
This kind of consolidation after a sharp move is completely normal and does not necessarily invalidate the bullish structure; it just means the market wants more confirmation before committing further capital.
The bearish scenario would involve ADA losing its grip on the recently reclaimed trendline and slipping back below 0.1901 on a daily close.
That would be a meaningful shift, essentially telling the market that the breakout lacked the conviction needed to hold, and sellers would likely push toward retesting 0.1709 as buyers step back and reassess.
Risks to Watch
Leverage is clearly elevated right now given how large futures volume is compared to spot volume, and that combination tends to produce sharper wicks and faster reversals than a purely spot-driven move would.
The upcoming treasury roundtable also introduces a governance variable that markets do not always price in smoothly, since any surprising outcome around fund allocation could shift sentiment quickly regardless of what the chart is showing.
Broader crypto market conditions remain another factor, since even a technically strong setup on ADA can be overridden by a sudden shift in risk appetite across the wider market.
Glossary
Descending trendline: A line connecting a series of lower highs, often used to identify resistance during a downtrend.
Daily close: The final price at which an asset trades before the daily candle finishes, often used to confirm breakouts.
Open interest: The total number of outstanding derivative contracts that have not been settled, reflecting active leveraged positioning.
RSI (Relative Strength Index): A momentum indicator that measures the speed and magnitude of recent price changes, typically ranging from 0 to 100.
Disclaimer
This article is for informational purposes only and does not constitute financial advice. Cryptocurrency markets are highly volatile, and readers should conduct their own research before making any investment decisions.
0
0

 从同一位置管理所有加密资产、NFT 和 DeFi 资产
安全地关联您正在使用的投资组合,以开始交易。


