
Blast Price Prediction: Why Is BLAST Token Surging Today?

0
0

Blast Price Prediction: Why Is $BLAST Token Suddenly Surging So Hard
Something woke up in the Blast token overnight, and traders are still trying to figure out what. A quiet Layer 2 name jumped into the middle of everyone's watchlist within hours. There's a chart pattern behind it, a volume spike behind that, and a question nobody has fully answered yet. Stick around and it'll make sense.
What Is Driving The Sudden $BLAST Token Price Jump
Blast price prediction chatter picked up fast once $BLAST started moving well beyond its usual daily range. The token is trading sharply higher over the past day, and that kind of move rarely happens without a reason sitting underneath it.
Turns out, this wasn't just a random green candle. Trading activity around $BLAST exploded compared to a normal session, and that volume told its own story before the price even confirmed it.
Basically, when a token this quiet suddenly gets loud, traders pay attention first and ask questions later. That's exactly what's happening across crypto Twitter and trading desks right now.
But is this the start of something bigger, or just a sharp reaction that fades in a few days? That's the part worth sitting with for a second.
Blast Coin Overview and Today's Key Numbers
| Metric | Value |
|---|---|
| Coin Name | Blast |
| Ticker Symbol | BLAST |
| Blockchain | Ethereum Layer 2 |
| Today High | $0.0004479 |
| Today Low | $0.0002718 |
| RSI Level | 68.45 |
| Token Type | Layer 2 Utility Token |
| Token Category | Blockchain Infrastructure |
| Market Cap | $24.7M |
| 24H Trading Volume Change | +2147.26% |
| Circulating Supply | 65.23B BLAST |
| 24H Change | +37.5% |
Source: Data by CoinMarketCap
Understanding What Blast Actually Does In Simple Terms
Blast is an Ethereum Layer 2 network, built to make transactions faster and cheaper than Ethereum's own mainnet. It launched with a twist most rivals didn't offer: native yield on assets simply sitting in the network.
People cared early because idle crypto usually earns nothing. Blast tried to change that by design, not as a bolted-on feature.
Why This Coin Matters Now In A Crowded Market
The token carries a CertiK rating of 4.1, which gives it a baseline of credibility most low-cap Layer 2 tokens don't have. That matters when traders are deciding whether a pump is worth chasing or worth avoiding.
And here's the thing: whale wallets currently control close to 88% of the supply, with just a handful of addresses holding the bulk of it. That concentration cuts both ways; it can pump fast and it can dump fast.
Blast Liquidation Data Shows Where Traders Got Squeezed
| Timeframe | Total Liquidations | Long Liquidations | Short Liquidations |
|---|---|---|---|
| 1 Hour | $10.39K | $9.74K | $648.54 |
| 4 Hours | $24.50K | $16.20K | $8.30K |
| 12 Hours | $291.41K | $104.50K | $186.91K |
| 24 Hours | $372.76K | $118.32K | $254.44K |
Source: Liquidation data by CoinGlass
Short sellers took the bigger hit over the past twelve and twenty-four hours. That lines up with a price that kept grinding higher while bears kept betting against it.
Fundamental Analysis Behind The Blast Token Rally
Fundamentally, $BLAST sits in an odd spot. The project has real backing and a working product, yet the token trades more than 99% below its all-time high of $0.5223 set back in June 2024.
We pulled up the on-chain data, and the first thing that stood out was volume against market cap. Daily volume of $53.1M against a $24.7M market cap gives a ratio of over 200%, meaning traders are flipping this token far faster than they're holding it.
That's a speculative crowd, not a conviction crowd. Worth remembering before anyone treats this move as a trend reversal.
Blast Technical Price Analysis Breaks Out Of Its Channel
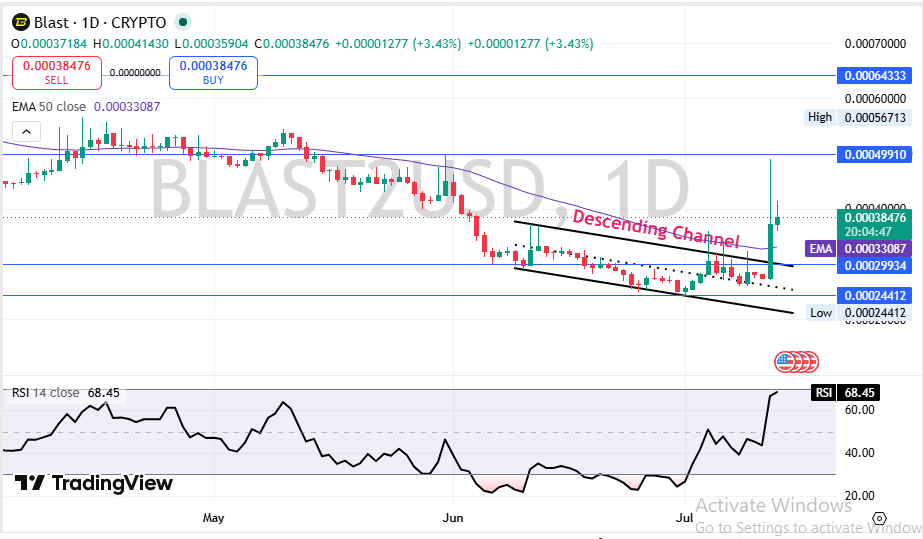
Here's what's moving fast right now. $BLAST just broke out of a descending channel it had been stuck inside since May, and it did it with real volume behind the candle.
Source: Charting by TradingView
On the 1-day chart, that breakout candle stands out clearly against weeks of tight, choppy price action.
Price is trading above its 50 EMA of $0.00033087, and RSI at 68.45 sits close to overbought without tipping over yet. That's a market leaning bullish, not neutral.
Immediate resistance sits at $0.0004991, with a bigger wall waiting at $0.00064333.
Immediate support sits at $0.00029934, and a close below $0.00024412 would flip this setup on its head.
But here's what most traders are missing: a breakout candle this sharp usually needs a retest before it holds. Watch how price behaves the next time it comes back near that channel line.
Blast Volume Heatmap Points To One Dominant Exchange
Bybit is carrying almost the entire spot volume load for $BLAST right now, at $30.53M, with MEXC and KuCoin trailing far behind at $2.28M and $744.10K.
Source: Volume heatmap by CoinGlass
Short-Term Blast Price Prediction For The Coming Weeks
In the short term, momentum favors the bulls, but an overbought RSI means a cooldown wouldn't be surprising either.
| Timeframe | Bearish Target | Base Target | Bullish Target | Key Trigger |
|---|---|---|---|---|
| 24 Hours | $0.00033 | $0.00040 | $0.00045 | RSI cooling off or extending |
| 3–7 Days | $0.00030 | $0.00042 | $0.00050 | Retest of breakout zone holds |
| 2–4 Weeks | $0.00025 | $0.00038 | $0.00064 | Volume sustains above average |
Watch that $0.0004991 level closely; it decides the next real move.
Long-Term Blast Coin Price Outlook Into Next Year
The long-term case depends entirely on whether Blast can rebuild trust after such a brutal fall from its all-time high.
| Timeframe | Bearish Target | Base Target | Bullish Target | Catalyst Needed |
|---|---|---|---|---|
| 3 Months | $0.00020 | $0.00040 | $0.00060 | Sustained exchange volume |
| 6 Months | $0.00015 | $0.00045 | $0.00080 | New ecosystem partnerships |
| End of Year | $0.00012 | $0.00050 | $0.00110 | Broader Layer 2 sector recovery |
| 2027 Outlook | $0.00010 | $0.00060 | $0.00150 | Real yield product adoption grows |
Fine. The long-term case isn't strong yet; it's speculative at best until adoption numbers back it up.
Three Price Scenarios Traders Should Prepare For
Worst Case: Volume dries up fast and whales start distributing into the stream. Price slides back under $0.00030 within days.
Base Case: $BLAST consolidates between $0.00033 and $0.00045 while the market decides if the breakout is real.
Best Case: Volume holds, resistance at $0.0004991 breaks clean, and price pushes toward $0.00064 over the coming weeks.
| Scenario | Price Range | What Triggers It |
|---|---|---|
| Worst Case | Below $0.00030 | Whale selling and a sharp drop in trading volume. |
| Base Case | $0.00033 - $0.00045 | Sideways consolidation with stable market activity. |
| Best Case | $0.00050 - $0.00064 | Breakout confirmation backed by sustained trading volume. |
Key Blast Price Levels Every Trader Should Watch
Resistance zone: $0.0004991 and, above that, $0.00064333, both capping upside until broken with volume.
Support zone: $0.00029934, the EMA-aligned floor that's held so far through this move.
Invalidation zone: Below $0.00024412, a close here would undo the entire bullish breakout thesis.
Analyst View And Final Thoughts On Blast Token
When we pulled up the daily chart, the descending channel breakout was the first thing that jumped out, and it came backed by real volume, not a thin wick.
RSI at 68.45 says buyers are firmly in control without being fully exhausted yet. A weekly close above $0.0004991 would go a long way toward confirming this isn't just a short squeeze.
Beyond the chart, keep an eye on the broader Bitcoin price outlook, since altcoins rarely run far on their own without Bitcoin cooperating. The fear and greed index is also worth a glance before sizing any position here.
Whale concentration above 87% remains the single biggest risk to this entire setup. That level of concentration means a handful of wallets could move this market in either direction within minutes.
The most important number on this chart right now is $0.0004991. Everything else is noise until that level breaks or holds.
Noted.
Disclaimer: This article is for educational purposes only and does not constitute financial advice. Crypto markets are volatile. Consult your investment advisor before making any investment decision.
0
0

 Verwalten Sie alle Ihre Kryptowährungen, NFTs und DeFi an einem Ort
Verbinden Sie sicher das Portfolio, das Sie zu Beginn verwenden möchten.