
Dogecoin Price Prediction: Don’t Miss DOGE’s Next Big Move

0
0

Dogecoin has spent the past several weeks squeezing into a tighter and tighter range, and the charts are starting to show two very different stories depending on the timeframe.
The short-term structure looks like it is coiling for a move; the longer-term structure is still working off a steep decline, and liquidation data shows leveraged traders getting hurt on one side far more than the other.
This Dogecoin price prediction outlook weighs all three against each other rather than leaning on just one chart.
What Is Driving Dogecoin Price Prediction Right Now?
DOGE is trading near $0.0741 this week, sitting inside a narrowing pattern on the 4-hour chart while the dailystill shows the aftermath of a sharp multi-week decline.
The near-term case for this Dogecoin price prediction rests on three inputs: a heavily long-sided liquidation profile over the past day, a 4-hour chart, compressing into a possible breakout setup and a daily RSI that has not yet confirmed a trend reversal.
None of these alone settles the debate, but together they frame a market at a genuine inflection point rather than a clean trend in either direction.
What Do Liquidation Trends Reveal About Traders?
According to Coinglass Liquidation data over the past day, it tells a lopsided story.
Over the trailing 24 hours, long positions accounted for $1.19M of the $1.59M wiped out, versus $393.80K on the short side, and the 4h and 12h windows show the same pattern, with longs making up over 95 percent of liquidations in each.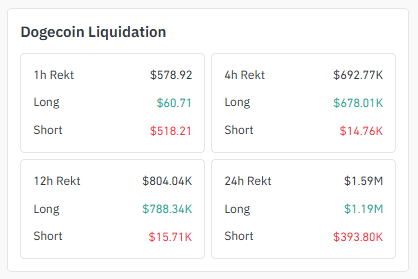
The 1-hour window flipped the other way, with $518.21 in short liquidations against just $60.71 in longs, hinting the very short-term bounce has already caught late short sellers off guard even as the broader day still favors long-side pain.
How Is Exchange Volume Shaping the Outlook?
As Per Coinglass Futures volume data aggregated via CoinGlass, Binance is carrying by far the largest share of DOGE activity at $324.83M, with OKX next at $233.18M and BingX at $111.19M. 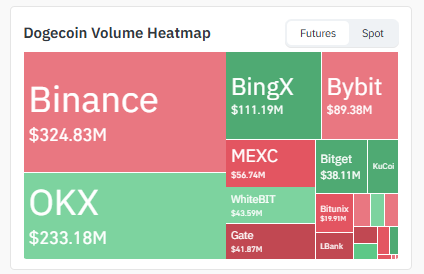
Bybit cleared $89.38M, while MEXC, WhiteBIT, Gate, and Bitget each contributed between $38M and $57M.
That concentration on two or three top venues means a sharp move on Binance or OKX tends to set the tone for the rest of the market quickly.
What Does the 4-hour Chart Say for Dogecoin Price Prediction?
The 4h chart tells a more balanced story. DOGE is compressing inside what looks like a symmetrical triangle, with resistance at $0.07576 and $0.07933 on the upper side and support at $0.07185 and $0.0696 on the lower side.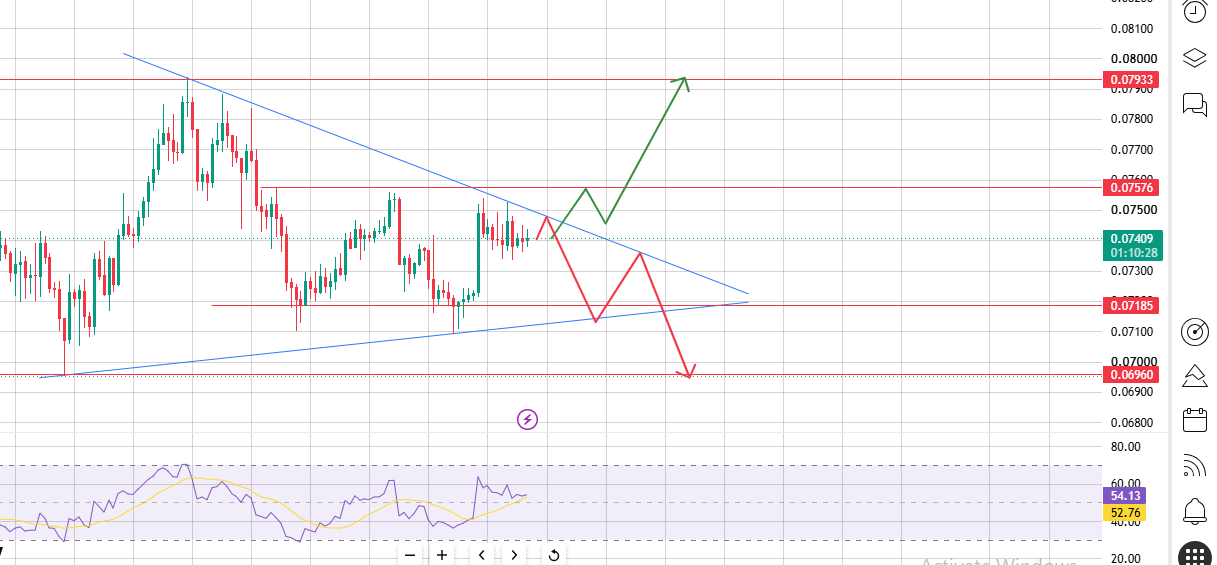
Source: Chart Taken From TradingView
A pattern like this typically resolves in one of two ways: if the price breaks and closes above the upper trendline, it tends to run toward the higher levels near $0.07576 and $0.07933.
If the breakout fails and price instead breaks down through the lower trendline, it tends to fall toward $0.07185 and then $0.0696.
The 4h RSI near 54 and moving average near 52.76 sit just above neutral, a modest improvement from the daily picture, but neither confirms which side of the triangle DOGE will break toward.
What Does the Daily Chart Say for Dogecoin Price Prediction?
On the daily timeframe, DOGE has fallen sharply inside a descending channel, and the RSI near 41 and the moving average near 38 both sit below the neutral 50 line, a setup that still leans bearish rather than confirming a reversal. 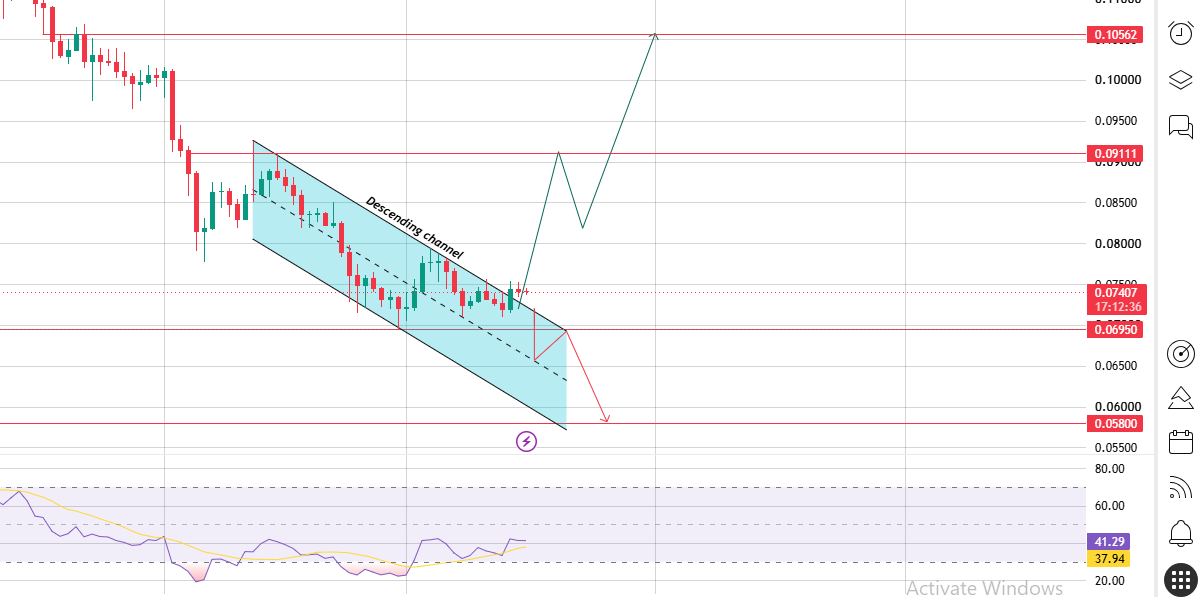
Source: Chart Taken From TradingView
Chart structure marks $0.0695 and $0.0580 as downside levels if the channel holds, with $0.09111 and $0.10562 as the levels a recovery would need to reclaim to change that picture.
What Are Analysts Saying About the Dogecoin Price Prediction?
Part of this Dogecoin price prediction picture comes from Trader Tardigrade, posting on X under the handle TATrader_Alan. 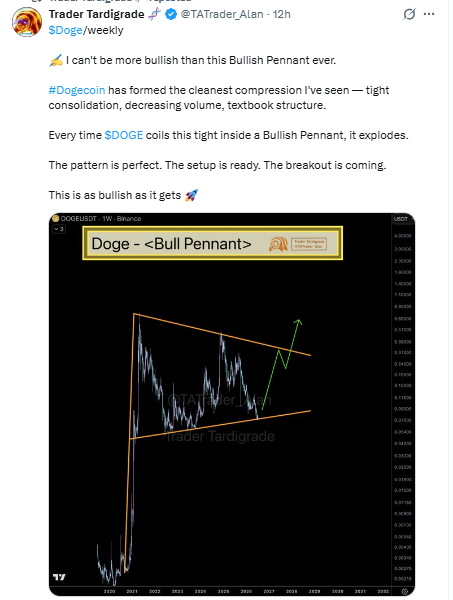
Looking at the weekly chart, the analyst described DOGE as forming a bullish pennant.
Pointing to tight consolidation and shrinking volume as a textbook setup that has historically preceded a breakout for the token, though the post did not specify a firm price target.
Bull Case vs Bear Case
Bull Case
If the 4h compression resolves upward and DOGE clears $0.07576 and then $0.07933, the weekly pennant structure flagged by Trader Tardigrade would gain support, opening a path toward $0.09111 and eventually $0.10562 on the daily chart.
Bear Case
A breakdown below $0.07185 and then $0.0696 would keep the daily downtrend intact, and with longs already absorbing the bulk of liquidations over the past day, a fresh leg down could trigger another round of long-side flushes before $0.0580 comes into view.
Quick Answer for Traders
Dogecoin is compressing between roughly $0.0696 and $0.07933 on the 4-hour chart, while the daily structure still points toward $0.0580 on the downside unless price reclaims $0.09111.
This Dogecoin price prediction view stays split between timeframes until one confirms the other.
Expert Opinion
Analysts covering this setup generally note the disagreement between timeframes as the defining feature right now.
The 4-hour compression and modestly improving RSI support a short-term bounce case, but the daily chart has not yet confirmed a trend change, and the liquidation data shows longs still absorbing most of the damage.
Traders are watching $0.07185 support and $0.07933 resistance as the levels most likely to decide near-term direction.
Disclaimer: This article is for informational purposes only and does not constitute financial, investment, or trading advice. Cryptocurrency markets, including Dogecoin, are highly volatile, and price levels discussed here may not materialize. Readers should conduct their own research and consult a licensed financial advisor before making investment decisions.
0
0

 Manage all your crypto, NFT and DeFi from one place
Securely connect the portfolio you’re using to start.

0
0


0
0
