The Graph (GRT) Price Prediction: Whales Hold the Key to Rebound
3d ago•

bullish:
0
bearish:
0
Share

The Graph (GRT) price movement throughout June was no different than what the other altcoins witnessed.
However, amidst the bearish conditions, the demand for artificial intelligence (AI) tokens did not decline.
The Graph Sees Interest From Investors
GRT price may have been noting a downtrend, but its desire among crypto enthusiasts remained as is. This is evident in the adoption rate of the asset. The adoption rate measures the concentration of new investors among the participating addresses.
The higher the domination of new investors among active addresses, the better the sign for the network. In the case of The Graph, this concentration has been between 28% and 30% for nearly three months now.
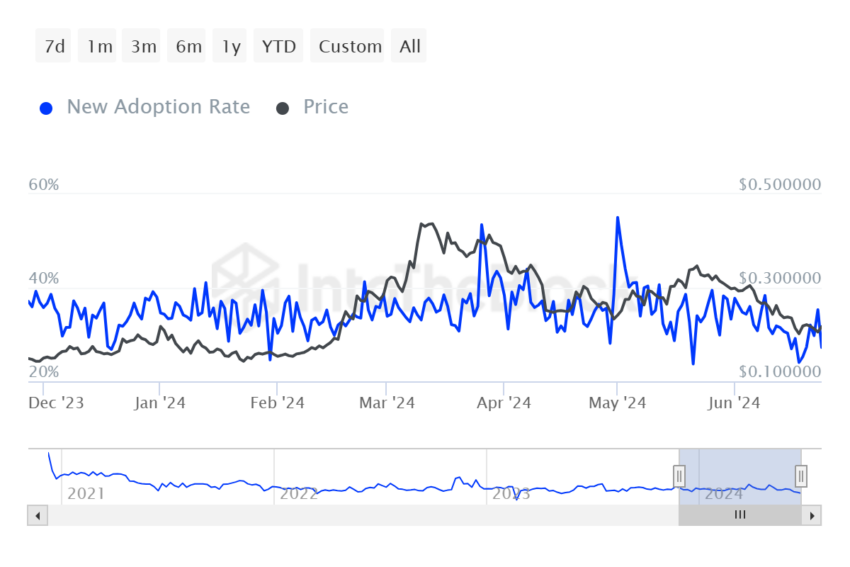 The Graph Adoption Rate. Source: IntoTheBlock
Potential investors continue to join the network irrespective of the broader market cues.
This same enthusiasm needs to be shown by one of the most important cohorts as well. Whales hold the majority of the circulating supply of GRT, a little over 52%. Since their actions tend to impact the price of the asset, their lack of participation hurts overall growth.
GRT whales have pulled back considerably since March. In May and June, their daily transaction volume averaged $10 million. In the past week, this dipped further to an average of $7 million.
Read More: Cryptocurrency Coins vs. Tokens: What’s the Difference?
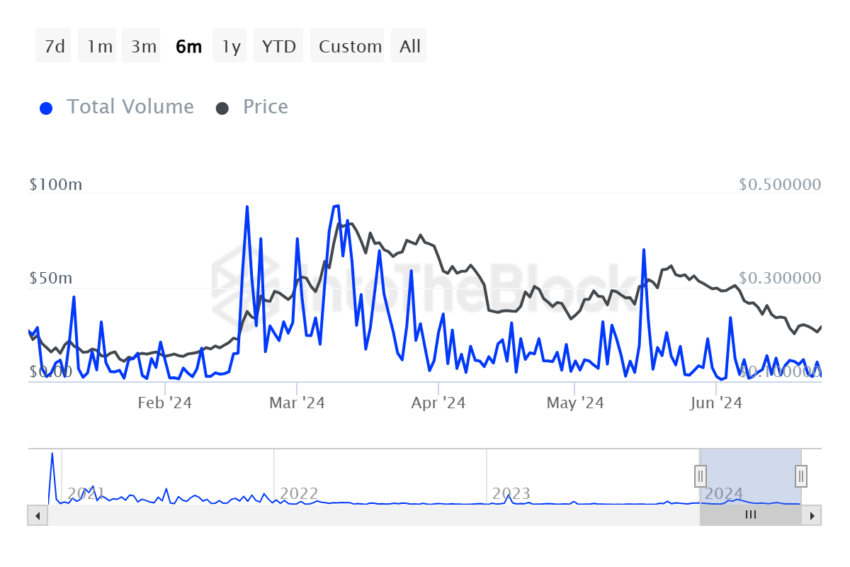 The Graph Whale Transaction. Source: IntoTheBlock
Thus, these whales must bounce back in terms of participation in order to assist GRT price recovery.
GRT Price Prediction: Room for Growth Ahead
GRT price, which is trading at $0.220 at the time of writing, has been hovering between $0.222 and $0.201 for the past week. During this period, attempts to breach the resistance failed, and the altcoin ended up testing the support.
Now, the on-chain metrics do highlight the potential for recovery, which could send The Graph above $0.250. Since $0.222 also marks the 23.6% Fibonacci Retracement, flipping it into support could aid the recovery.
The target for the GRT price is to reclaim $0.266 as a support level, coinciding with the 38.2% Fib level.
Read More: The Graph (GRT) Price Prediction 2024/2025/2030
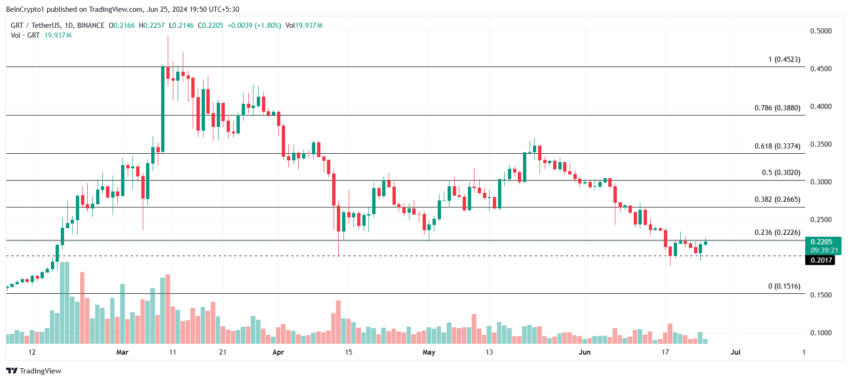 The Graph Price Analysis. Source: TradingView
However, if a lower low is formed below $0.201, the altcoin is vulnerable to a correction. The crypto asset could drop to $0.151, invalidating the bullish thesis.
3d ago•
bullish:
0
bearish:
0
Share


 Manage all your crypto, NFT and DeFi from one place
Securely connect the portfolio you’re using to start.

bullish:
0
bearish:
0

bullish:
0
bearish:
0

