Is XRP Market Signaling ‘Buy The Dip’ Mood in May?
20d ago•

bullish:
1
bearish:
0
Share
Key Takeaways:
- XRP price struggled to clear the $0.580 resistance and corrected lower.
- A major bearish trend line is forming with resistance at $0.540 on the daily chart.
- The price must clear the 50-day simple moving average (blue) to start a fresh rally.
NEW DELHI (CoinChapter.com) — XRP is still struggling below $0.580 and $0.615. The price must stay above the $0.4750 support zone to attempt another increase in the near term.
XRP Price Faces Uphill Task
In the last weekly analysis, we discussed how XRP bulls face a major resistance near the 50-week simple moving average at $0.580. The price did attempt a fresh increase above the $0.550 resistance zone, but the bears were active near $0.580.
More importantly, the 50-day simple moving average (blue) and the 50-week simple moving average are around the same region at $0.580. There is also a major bearish trend line forming with resistance at $0.540 on the daily chart.
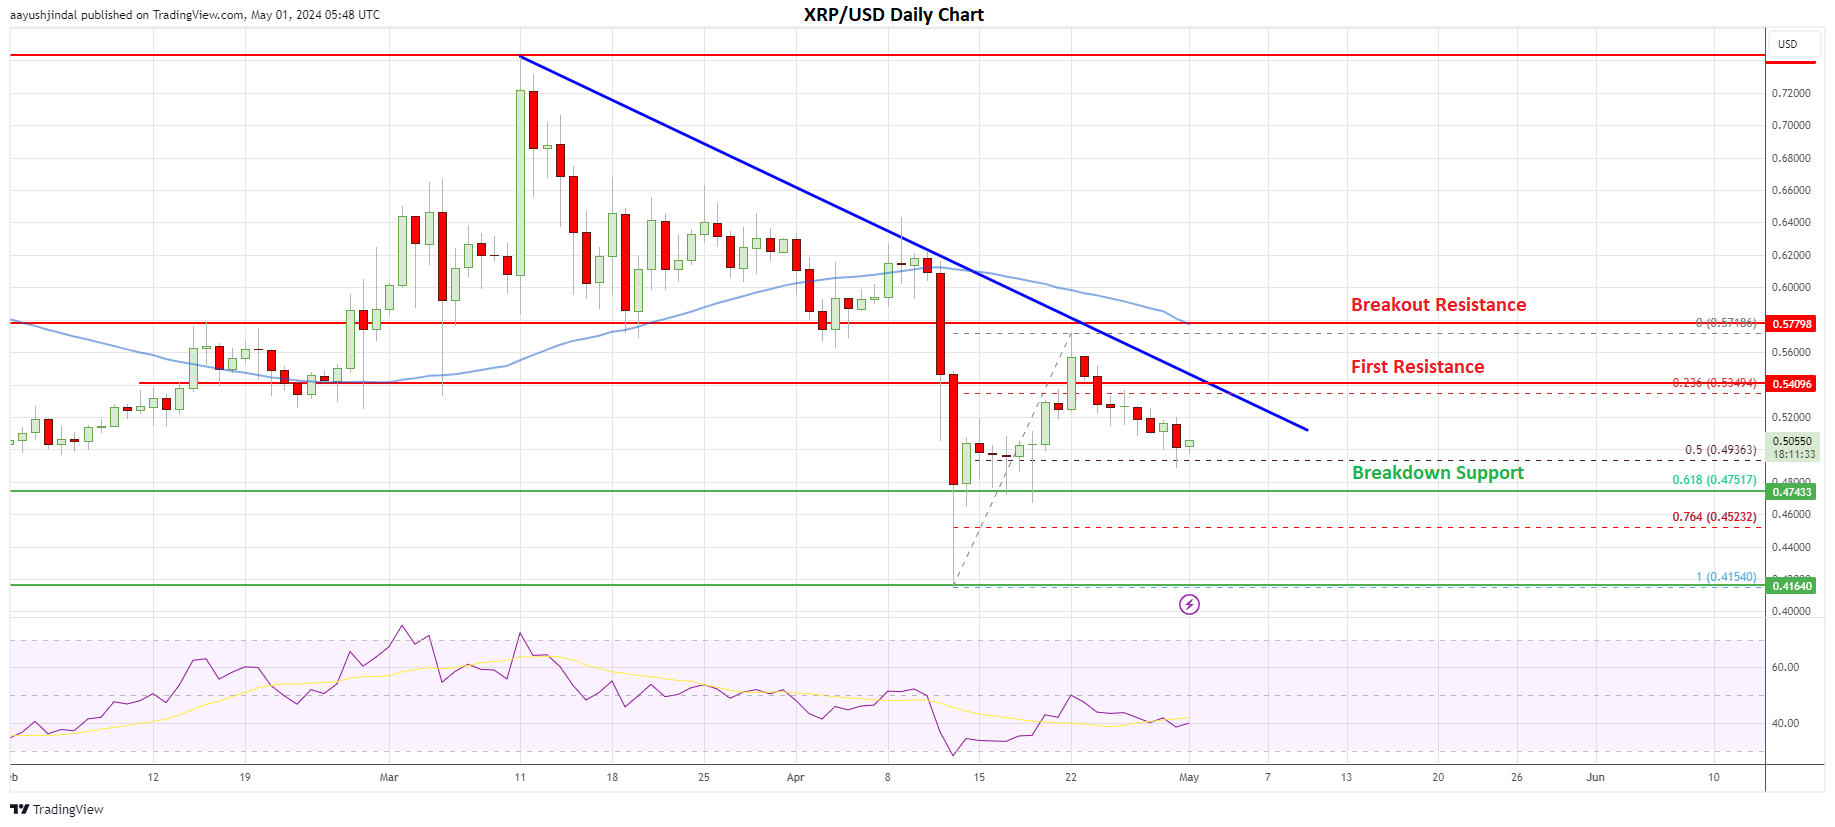
After forming a short-term top at $0.5718, XRP is now correcting gains, like Ethereum. There was a move below the $0.520 support and the price tested the 50% Fib retracement level of the upward move from the $0.4154 swing low to the $0.5718 high.
The current price action is negative, but there are many important supports on the downside starting with $0.4920. The first major support sits at the 61.8% Fib retracement level of the upward move from the $0.4154 swing low to the $0.5718 high at $0.4750.
If the bulls fail to protect the $0.4750 support, XRP price might extend losses and test $0.4520. The main uptrend support (discussed many times in the weekly analysis) is still $0.4150. A downside break below the $0.4150 support might increase selling pressure. In the stated case, the price may decline toward the $0.300 level.
Upside Break?
Conversely, XRP price might start another increase. Immediate resistance is near the $0.520 level. The first key resistance sits near the trend line at $0.540.
The main breakout resistance is seen near the 50-day simple moving average (blue) at $0.580. To start a fresh rally, the bulls need to convincingly clear the $0.580 resistance zone. The next key hurdle sits near the $0.6150 level.
If the bulls manage to push the price above the $0.6150 resistance, there could be a strong upward move. The next stop for them might be $0.700. Any more gains might send the price toward $0.740 or even $0.7650.
Fundamentally, Ripple continues to expand. Recently, they announced a partnership with the HashKey Group and SBI Group to Introduce XRP Ledger-Powered Enterprise Solutions in Japan.
We’re excited to announce a partnership between @Ripple, @HashKeyGroup, and SBI Group ushering in #XRPL-powered solutions, starting with supply chain finance, to Japan's enterprise landscape.
— Ripple (@Ripple) April 30, 2024
Learn more about this innovative partnership: https://t.co/GFUNdu1ci2

Overall, the XRP price is facing many hurdles at $0.540 and $0.580. The bulls need to soon push the price above $0.580 and then $0.6150. If not, there might be a strong decline toward the $0.4150 support in the coming sessions.
The post Is XRP Market Signaling ‘Buy The Dip’ Mood in May? appeared first on CoinChapter.
20d ago•
bullish:
1
bearish:
0
Share

 Manage all your crypto, NFT and DeFi from one place
Securely connect the portfolio you’re using to start.

bullish:
0
bearish:
0


