
Quant Down 14%. Here are Reasons to Expect Steeper Decline

0
0
Quant recorded one of its strongest bullish runs over the weekend. Nonetheless, the uptrend started much earlier.
A closer look at the 1-day chart shows that QNT gained an impressive 53% on Saturday, bringing it closer to flipping its two-year high around $171. Following the surge above $150, more than $4 million in positions were liquidated, with short positions accounting for about 80% of the losses.
However, the liquidations were relatively small compared with what happened the following day.
QNT almost tripled Saturday’s gains at its peak on Sunday, surging more than 147% before ending the session up by over 89%. Liquidations also increased significantly, reaching roughly six times Saturday’s figure. Short positions accounted for more than $18 million in liquidations, while long positions recorded more than $7 million in losses.
Overall, QNT gained more than 142% during the weekend rally, while total liquidations exceeded $29 million. According to CoinGlass data, this represents the highest recorded liquidation figure for the asset.
Away from the weekend surge, QNT has been on an impressive uptrend since September 18. Between September 18 and 27, the asset gained more than 371%.
Initially, QNT joined the broader cryptocurrency market as fresh liquidity entered the sector. However, a different fundamental catalyst appears to have accelerated the rally from September 22.
On September 22, six of Canada’s largest banks announced a joint initiative to explore a shared Canadian-dollar tokenized deposit network built on Quant Network. The announcement was followed by a roughly 10% increase in QNT’s price.
Two days later, The Clearing House selected Quant to power its new On-Chain Money Initiative, which is designed to support the clearing and settlement of tokenized bank deposits.
On September 24, QNT gained another 24% as the news spread and investors assessed the potential scale of the initiative and what the development could mean for Quant’s ecosystem. However, the euphoria began to fade the following day.
Bullish Speculation Pushed Quant Higher
Although the uptrend slowed on Friday, momentum returned the following day. QNT surged above $120, attracting the attention of additional investors.
One prominent QNT proponent added further fuel to the rally with a post published at around 9 p.m. UTC that has since generated more than 13 million views.
Jan Nieuwenhuijs urged his followers to buy at least one QNT, framing the trade as a bet in which investors could risk roughly $120 for a potential $10,000 return. Nieuwenhuijs had previously advocated buying Bitcoin, and his latest comments attracted significant attention from QNT investors. The post coincided with another sharp increase in QNT’s price.
However, the asset is trading down by over 17% on Monday. The bulls attempted to counter the selloff with buybacks, but their efforts were not enough to sustain the recovery. The chart now suggests that this could be the beginning of a broader downtrend.
What Next?
The Relative Strength Index is currently in overbought territory on both the 1-day and weekly charts. On the shorter timeframe, the indicator surged to its highest level in more than two years. Although it is now declining, QNT remains firmly in overbought territory.
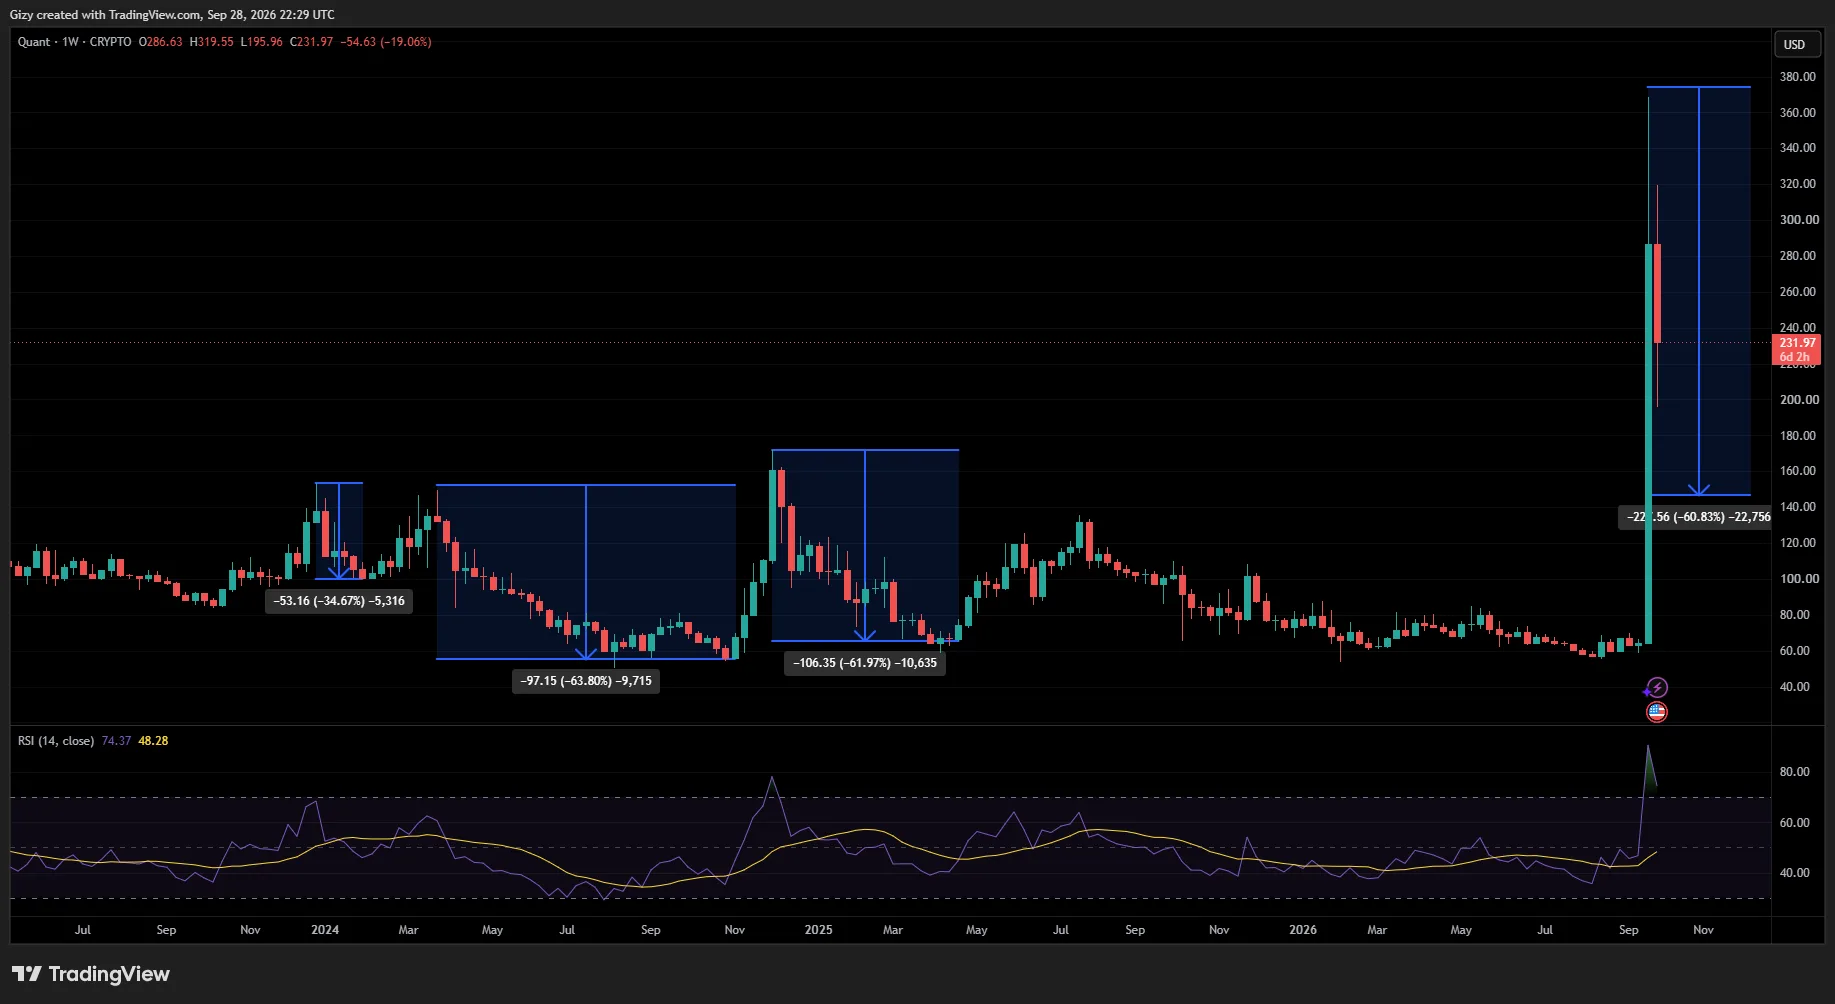
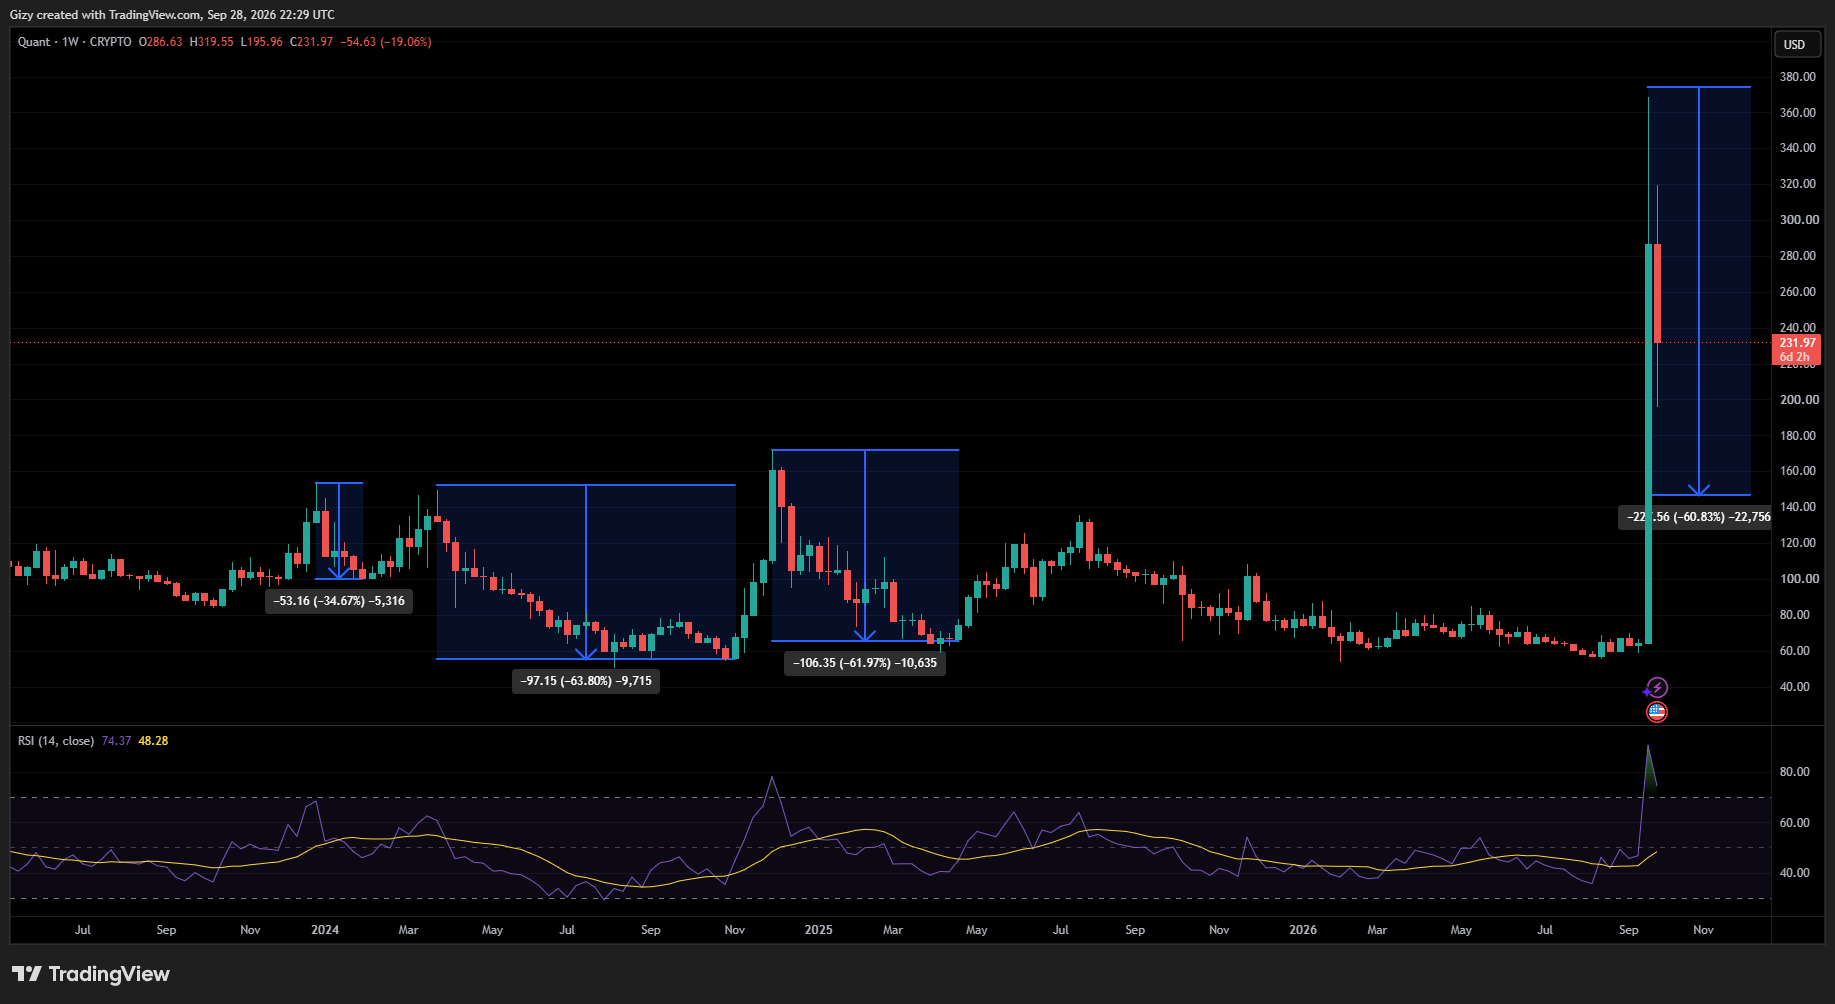
On the 1-week timeframe, the RSI reached its highest level since inception. To put this into perspective, QNT has entered overbought territory only a handful of times on the weekly chart, and on each occasion, the asset subsequently declined by between 30% and 60%. The chart provides a clearer picture of how these corrections played out.
Based on previous price movements and the current RSI levels, Quant may be entering a period of significant downside in the coming days. With the indicator rising as high as 90, a 60% correction may appear possible based on historical price action. If such a decline occurs, QNT could retrace below the $150 level.
The post Quant Down 14%. Here are Reasons to Expect Steeper Decline appeared first on CoinTab News.
0
0

 Manage all your crypto, NFT and DeFi from one place
Securely connect the portfolio you’re using to start.


