Bitcoin, Ethereum, Ripple Weekly Wrap – June 21
6d ago•

bullish:
1
bearish:
0
Share

The big three crypto assets have all had a rather bearish week, with Bitcoin’s (BTC) price falling while Ethereum’s (ETH) and Ripple’s (XRP) prices consolidating. Over the weekend, all three of these assets will likely retain this outlook.
BeInCrypto has analyzed where BTC, ETH, and XRP could land following this bearish week.
Bitcoin’s Price Subdued
Bitcoin’s price has been following a bearish double-top pattern for the past month. A double-top pattern is a bearish reversal formation characterized by two peaks at a similar level, indicating strong resistance.
It suggests that the asset’s price is likely to decline after failing to break through the resistance twice.
As BTC broke below the neckline, intense bearishness pursued. Consequently, the crypto asset fell from the neckline at $67,504 to the trading price of $63,6723. BTC is now closer to the target price of $63,068, as set by the bearish pattern, and could hit it over the weekend.
Read More: Bitcoin Halving History: Everything You Need To Know
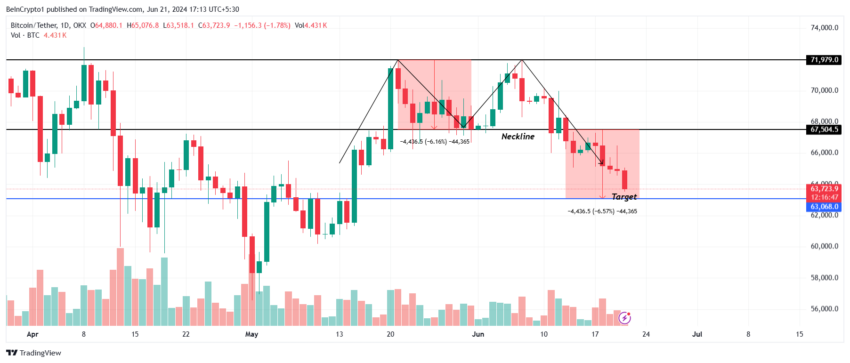 Bitcoin Price Analysis. Source: TradingView
At the same time, a bounce back in Bitcoin’s price is also expected. However, if it comes earlier, BTC could reclaim the support of $64,00 and $66,000. This would enable recovery and invalidate the bearish thesis.
Ethereum’s Price Halts Recovery
Ethereum’s price at $3,496 has been consolidated between $3,669 and $3,336. These levels form the 38.2% and 50% Fibonacci Retracement levels. ETH has been within this range for the last two weeks after the altcoin lost support at $3,700.
It remains to be seen whether Ethereum’s price can break above or below the consolidation range. However, the chances of sideways movement continuing this weekend are very high.
Read More: How to Invest in Ethereum ETFs?
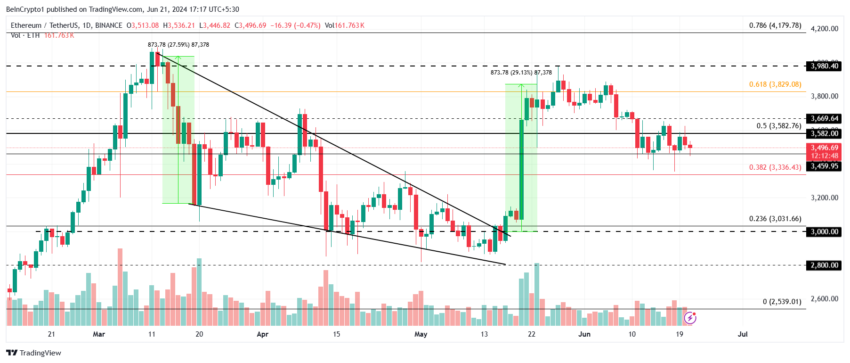 Ethereum Price Analysis. Source: TradingView
This bearish, neutral thesis would be invalidated if either of the range limits were disrupted, potentially sending ETH rallying to $3,800 or falling to $3,200 on the charts.
XRP Price Sees No Rally Either
The XRP price, hovering between $0.47 and $0.52, faces bearishness after failing the ascending triangle. Changing hands at $0.49, the altcoin could attempt to reclaim $0.51 as a support floor, which would also flip the 23.6% Fibonacci Retracement into support.
The sideways movement could continue since the broader market cues are not supporting a recovery right now. The aforementioned consolidation range could remain intact for a while.
Read More: Ripple (XRP) Price Prediction 2024/2025/2030
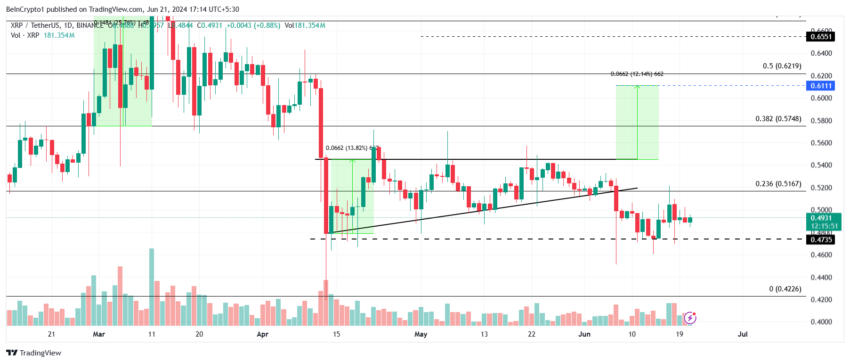 XRP Price Analysis. Source: TradingView
Nevertheless, the price could fall if XRP holders move to offset their losses by selling their holdings. This could result in a $0.46 or lower drawdown, invalidating the bullish–neutral thesis.
6d ago•
bullish:
1
bearish:
0
Share


 Manage all your crypto, NFT and DeFi from one place
Securely connect the portfolio you’re using to start.

bullish:
0
bearish:
0

bullish:
0
bearish:
0

bullish:
0
bearish:
0
