
PEPE Price Prediction August 2026: $PEPE Triangle Or Breakdown?

0
0

Nobody is shouting about this coin right now, and that is exactly the point. A frog token that spent most of last year in the headlines has gone quiet, drifting inside a tight range while its chart quietly builds two conflicting patterns at once. One says to buy the dip. The other says the dip has not finished dipping. Which one is lying?
PEPE Price Prediction: Why This Triangle Keeps Getting Retested
Every PEPE price prediction august 2026 conversation starts with the same shrug. Nothing dramatic happened today.
But that is not the same as nothing happening.
For months, $PEPE has been carving out a pattern on the daily chart that traders love to point at, an ascending triangle, the kind that usually resolves upward. At the same time, the weekly chart is telling a slower, heavier story: a falling wedge that has been compressing since last year's highs.
Two patterns, two timeframes, two different moods. One is optimistic. One is tired.
We keep coming back to the same question when we pull these charts up: does a bullish setup even matter if the token cannot hold a green weekly candle? Let's get into what the data actually shows.
Key Takeaways
PEPE price today sits near $0.000002741 as of 18:59 UTC, July 31, 2026, up 0.14% on CoinMarketCap's 24-hour window, but the weekly candle is still down 8.05% with roughly two days left before it closes.
Daily RSI reads 48.06, sitting almost dead center, neutral. Weekly RSI reads 39.16, below the midline and closer to weak than oversold.
The daily chart is forming an ascending triangle with resistance near $0.00000310. The weekly chart is inside a falling wedge that has been building since 2025.
24-hour liquidations hit $147.46K, and $130.95K of that came from longs, not shorts, an unusual imbalance for a coin most traders assume is oversold.
Whale concentration sits at 88.70%, held by just 477 wallets, 0.08% of all holders. The Gini score is 0.9934, one of the more concentrated setups CoinGabbar has flagged this year.
$PEPE has no unlock schedule left to worry about. The circulating supply already matches the max supply at 413.77 trillion tokens.
Table of Contents
Why PEPE Is Stuck Below Resistance
PEPE Technical Analysis: What the Charts Show
PEPE Support and Resistance Levels
Tokenomics and Whale Concentration
Where $PEPE Is Actually Trading
$PEPE and the Wider Meme Coin Sector
PEPE Price Prediction 2026: Scenarios by Timeframe
Will PEPE Reach $1? Can It Reclaim Its All-Time High?
PEPE Market Outlook: Risks to Watch
Glossary
Methodology
Why PEPE Is Stuck Below Resistance
Here's the thing: $PEPE is not crashing, and it's not rallying either.
It's stuck.
Price moved from an open of $0.00000277 to a low of $0.00000272 before closing at $0.00000274 on the daily candle, a loss of just 0.72%. Quiet on paper.
Zoom out to the weekly chart, and it's a different picture. The week opened at $0.00000298, ran up to $0.00000310, then fell all the way back to $0.00000274. That is an 8.05% weekly loss sitting inside a candle that has not even closed yet.
So which timeframe do you trust?
PEPE has faked a recovery inside a bigger downtrend before too, and that long liquidation wedge pullback played out in a similar way.
The mechanical side backs up the weak read. Over the past 24 hours, per Coinglass liquidation data, $147.46K in positions got wiped out, and $130.95K of that came from longs. Traders betting on a bounce are the ones paying for it right now.
That imbalance held across every window Coinglass tracks. In the last hour alone, $27.13 in liquidations, all long. In the last four hours, $131.12K was made, with $120.21K coming from longs against just $10.91K in shorts.
Basically, every leveraged bet on a quick recovery has been getting punished.
PEPE Technical Analysis: What the Charts Show
This is the core of any real $PEPE price prediction 2026 right now, and the daily and weekly timeframes genuinely disagree with each other.
Daily Chart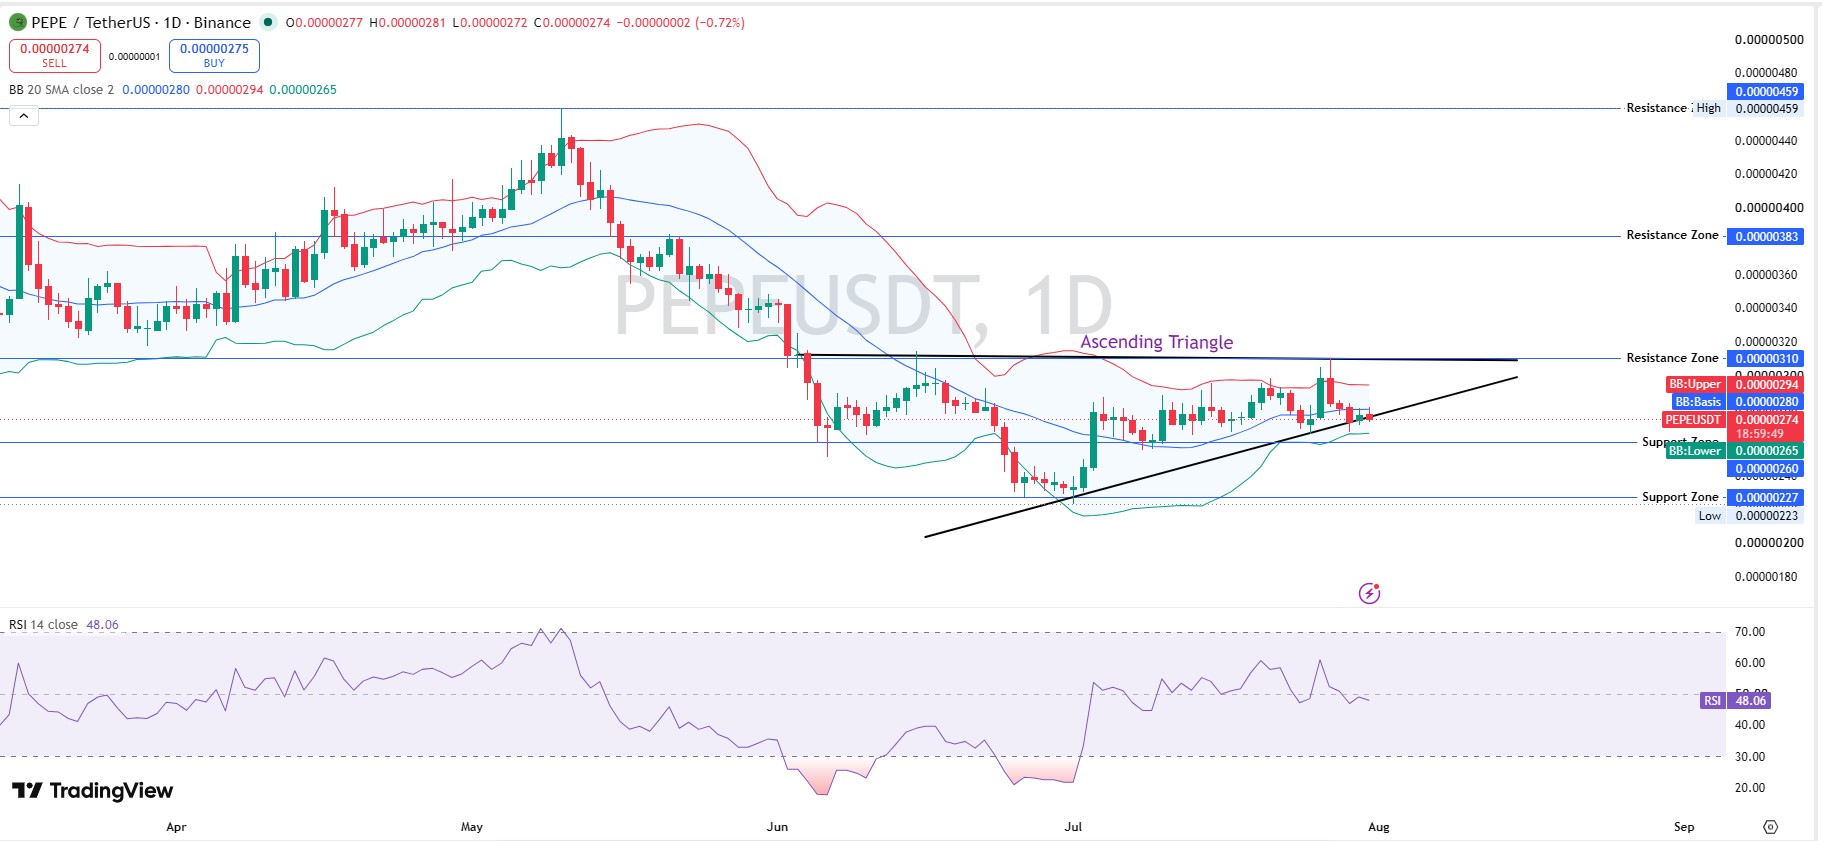
On the daily PEPE/USDT chart on TradingView, price has been carving out an ascending triangle since June, a pattern where higher lows meet a flat resistance ceiling. That ceiling sits close to $0.00000310, which lines up almost exactly with the daily Bollinger Band upper level of $0.00000294.
Daily RSI sits at 48.06. Not overbought. Not oversold. Just tired.
The daily Bollinger Bands show a basis of $0.00000280, an upper band of $0.00000294, and a lower band of $0.00000265. Price is currently trading right between the basis and the lower band, which is not a strong place to be.
A break above the triangle's flat top, with real volume behind it, would be the clearest short-term $PEPE breakout signal on the board. This kind of setup has played out for $PEPE before, and the PEPE price prediction 2027 piece tracks the same pattern over a longer stretch.
Weekly Chart
The weekly chart is where the real caution lives.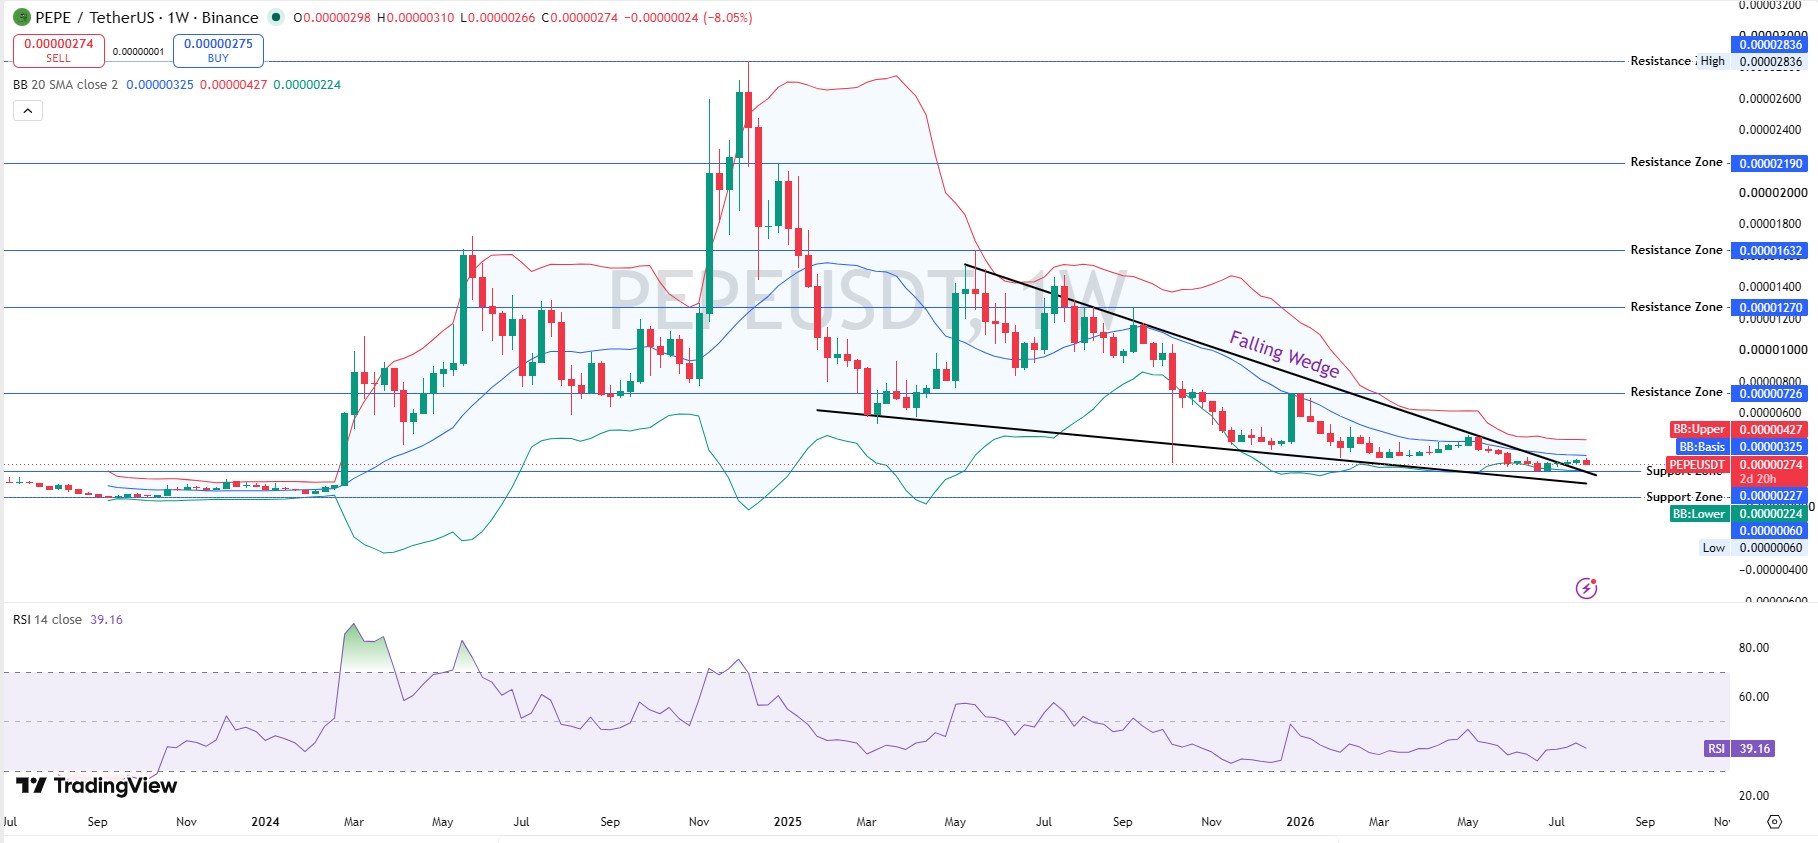
PEPE has been inside a falling wedge since the highs of late 2024 and into 2025, a pattern that usually, not always, resolves upward once it breaks. The problem is this wedge has been forming for a long time, and long wedges can grind lower before they ever confirm.
Weekly RSI reads 39.16. That's below the neutral 50 line, though not deep enough to call oversold in the textbook sense.
The weekly Bollinger Bands show a basis of $0.00000325, an upper band of $0.00000427, and a lower band close to $0.00000224. The price at $0.00000274 is sitting below its own weekly basis, closer to the lower band than to the middle of the range.
That gap between a neutral daily RSI and a soft weekly RSI is the whole tension in this pepe price prediction for the August 2026 setup. Short-term traders see stabilization. Anyone holding for the month sees a chart that has not proven anything yet.
PEPE Support and Resistance Levels
$PEPE resistance levels on the daily chart start at $0.00000310, the triangle's flat top, then $0.00000383, then a longer-range high near $0.00000459.
On the weekly chart, resistance is layered further out: $0.00000726, then $0.00001270, then $0.00001632, then $0.00002190, with the all-time high sitting at $0.00002836.
PEPE support levels sit at $0.00000265, the daily Bollinger lower band, then the support zone near $0.00000227, with the daily low at $0.00000223 marking the floor traders are watching most closely.
A daily close under $0.00000265 would put the triangle thesis in real doubt. A close under $0.00000227 would be a clearer signal that the falling wedge is continuing, not reversing.
Tokenomics and Whale Concentration
Now, the most casual $PEPE crypto price predictions skip entirely.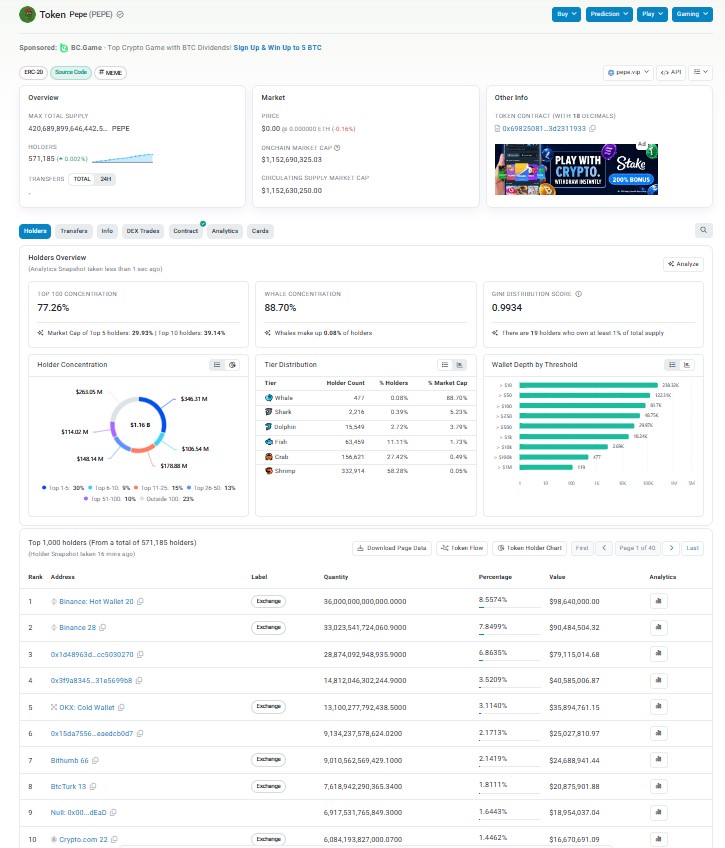
Per CoinMarketCap, $PEPE has a total and max supply of 413.77 trillion tokens, and the circulating supply already matches that figure. There is no unlock schedule left to worry about, no future dilution hanging over the chart. Market cap sits at $1.13B, and FDV is identical, at $1.13B, because there's nothing left to unlock.
Holders stand at 571.25K, according to on-chain wallet data verified against Etherscan's token page, up marginally over the past day.
But supply structure is only half the tokenomics story.
Top 100 wallets hold 77.26% of the circulating supply. Whale-tier wallets, just 477 addresses, 0.08% of all holders, control 88.70% of market cap. The Gini distribution score sits at 0.9934, with 19 wallets each holding at least one percent of total supply on their own.
Tier by tier: Whale wallets (477) hold 88.70% of the cap. Shark wallets (2,013) hold 5.23%. Dolphin wallets (15,349) hold 3.79%. Fish wallets (63,459) hold 1.73%. Crab and shrimp tiers, close to 490,000 wallets combined, hold under 1% between them.
That's about as top-heavy as a token this size gets.
The largest wallet is Binance Hot Wallet 20, holding 8.5574% of the supply, worth close to $98.64M. Second is another Binance wallet holding 7.8499%, worth $90.48M. Third is an unlabeled address holding 6.8635%, worth $79.12M, and we cannot confirm whether that's a treasury, a market maker, or an individual holder.
Worth noting: the ninth-largest wallet is a null address, the standard burn wallet, holding 1.6443% of the supply, permanently out of circulation. Large wallet movements like this get flagged as they happen on the crypto news desk.
Two of the top five wallets belong to OKX and Binance directly, custodial exchange balances representing thousands of individual users, not one seller waiting to dump. That distinction matters before anyone calls this pure whale risk.
Where $PEPE Is Actually Trading
Futures volume tells its own story. Per Coinglass's PEPE derivatives dashboard, MEXC carries the largest share at $102.90M, followed by OKX near $53.80M, LBank at $19.48M, Bitget at $14.53M, Gate near $9.72M, KuCoin at $9.70M, and Bitunix at $7.12M, with smaller volume on WhiteBIT and Coinbase.
Add those together and futures volume across just the visible venues runs past $200M, well above the $143.07M in 24-hour volume CoinMarketCap reports for the broader market, which is down 10.31% from the prior day.
When futures activity outpaces spot volume by that much, leverage is doing most of the talking. Organic accumulation, not so much. Fresh liquidity tends to show up around new listings first, which is why the exchange listing tracker is worth checking alongside volume data like this.
That lines up with the liquidation data. Longs have taken the bulk of the pain across every window Coinglass tracks; the one-hour, four-hour, twelve-hour, and twenty-four-hour numbers all point in the same direction.
$PEPE and the Wider Meme Coin Sector
PEPE rarely moves on its own news. It moves with the mood of the whole meme coin sector.
When DOGE and SHIB catch a bid, $PEPE usually follows within hours. When risk appetite fades, meme coins tend to bleed first and recover last.
That's part of why the daily and weekly charts disagree right now. A short-term bounce can come purely from sector rotation, without $PEPE doing anything different on its own.
Any real meme coin analysis has to weigh that in. Thin, correlated liquidity across the sector amplifies both the pumps and the drawdowns.
PEPE Price Prediction 2026: Scenarios by Timeframe
Treat this table as a working PEPE price forecast, not a signal to copy directly. It covers a PEPE price prediction for today, for the coming week, and for the rest of 2026 side by side, and the full price prediction hub has setups for other tokens if you want to compare.
Timeframe | Bull Case | Base Case | Bear Case |
24H | Reclaims $0.00000281, pushes toward the $0.00000294 upper band (probability: low-moderate) | Holds $0.00000265-$0.00000280, drifting inside the range (probability: high) | Slips under $0.00000265 toward the $0.00000227 zone (probability: moderate) |
7D | A weekly close back above $0.00000298 reopens the path to $0.00000310-$0.00000383 (probability: low) | Range-bound between $0.00000227 and $0.00000310 while the triangle gets retested again (probability: high) | A weekly close under $0.00000224 confirms the falling wedge is still leading (probability: moderate) |
2026 | A meme-sector rotation carries PEPE toward the $0.00000726-$0.00001270 weekly resistance band, roughly two to four times current levels (probability: low-moderate) | Chops in a $0.0000020-$0.0000045 range tracking broader risk sentiment (probability: moderate) | Concentration-driven selling or a fading meme cycle drags PEPE toward $0.0000015-$0.0000020 (probability: low-moderate) |
Invalidation for the bullish case is a daily close under $0.00000265. A weekly close under $0.00000224 would confirm the deeper structure has turned. These are directional reads based on the current chart, not guarantees, and probability labels reflect relative likelihood, not statistical certainty.
Will PEPE Reach $1? Can It Reclaim Its All-Time High?
No. Not close, and this one doesn't need much hedging.
Getting from $0.000002741 to $1 requires roughly a 365,000x move. At the current circulating supply of 413.77 trillion tokens, a $1 PEPE would carry a market cap north of $413 trillion. That's larger than the entire global economy.
Fine. So that's off the table.
A more grounded question is whether $PEPE can reclaim its own all-time high of $0.00002825, set back on December 9, 2024. That would take roughly a 10.3x move from current levels, and $PEPE is currently sitting 90.3% below that peak, per CoinMarketCap's price performance data.
Closer to realistic is the weekly resistance band at $0.00000726 to $0.00001270, which would represent something like a 2.6x to 4.6x move. The full multi-year path gets mapped out in the PEPE price prediction 2030 breakdown, which walks through what a wedge resolution like that could look like further out.
PEPE Market Outlook: Risks to Watch
Whale concentration tops the list again. A Gini score of 0.9934 and 477 wallets controlling 88.70% of market cap is a structural risk that does not disappear just because a candle turns green.
Leverage is next. Futures volume running ahead of reported spot volume means moves can unwind fast in either direction, and right now the unwinding has favored longs getting hurt, not shorts.
And momentum is soft. A neutral daily RSI paired with a weekly RSI under 40 is not the setup you want heading into a bullish breakout attempt. Wider market context, like the Bitcoin price prediction 2026, helps explain how the broader trend could pull altcoins like PEPE along with it.
Meme-sector rotation cuts both ways too, since $PEPE tends to move with risk appetite across the whole category rather than on its own news. Anyone tracking how ETH-based liquidity feeds into meme coin volume can check the Ethereum price prediction 2026 for that angle.
Glossary
RSI (Relative Strength Index): A 0-100 momentum gauge; readings under 50 suggest weaker momentum, and above 70 usually flags overbought conditions.
Bollinger Bands: Bands plotted around a moving average that widen and narrow with volatility; price trading near the lower band signals weaker short-term strength.
Ascending Triangle / Falling Wedge: Chart patterns marked by converging trendlines; both are generally read as continuation or reversal setups that lean bullish once confirmed, though neither guarantees an outcome.
Gini Score: A 0-to-1 measure of token distribution; closer to 1 means supply sits in very few hands.
FDV (Fully Diluted Valuation): What market cap would there be if every token, including any still locked, were circulating? For PEPE, FDV already equals market cap since nothing remains locked.
Methodology
Chart levels came from PEPE/USDT daily and weekly charts on Binance via TradingView, using RSI-14 and 20-period Bollinger Bands, with data captured at 18:59 UTC on July 31, 2026. Price, supply, and market cap data came from CoinMarketCap as of the same snapshot; holder concentration and Gini score from on-chain wallet analytics, cross-checked on Etherscan; and liquidation and futures volume from Coinglass, also captured at 18:59 UTC, July 31, 2026.
PEPE is an ERC-20 token running on 18 decimals, contract address 0x6982508145454ce325ddbe47a25d4ec3d2311933, carrying a CertiK rating of 4.4 out of 5.
This is a live snapshot, and levels can shift as new data comes in. For contract verification and audit history, check the project's own updates via its official X account.
Disclaimer: This is speculative market commentary, not financial or investment advice. Crypto assets are volatile and can lose most or all of their value. Verify live figures before trading.
0
0

 Manage all your crypto, NFT and DeFi from one place
Securely connect the portfolio you’re using to start.

0
0

0
0

0
0

0
0