Dogecoin Crypto at $0.08: Last Support Holds as Fear Hits 15

0
0
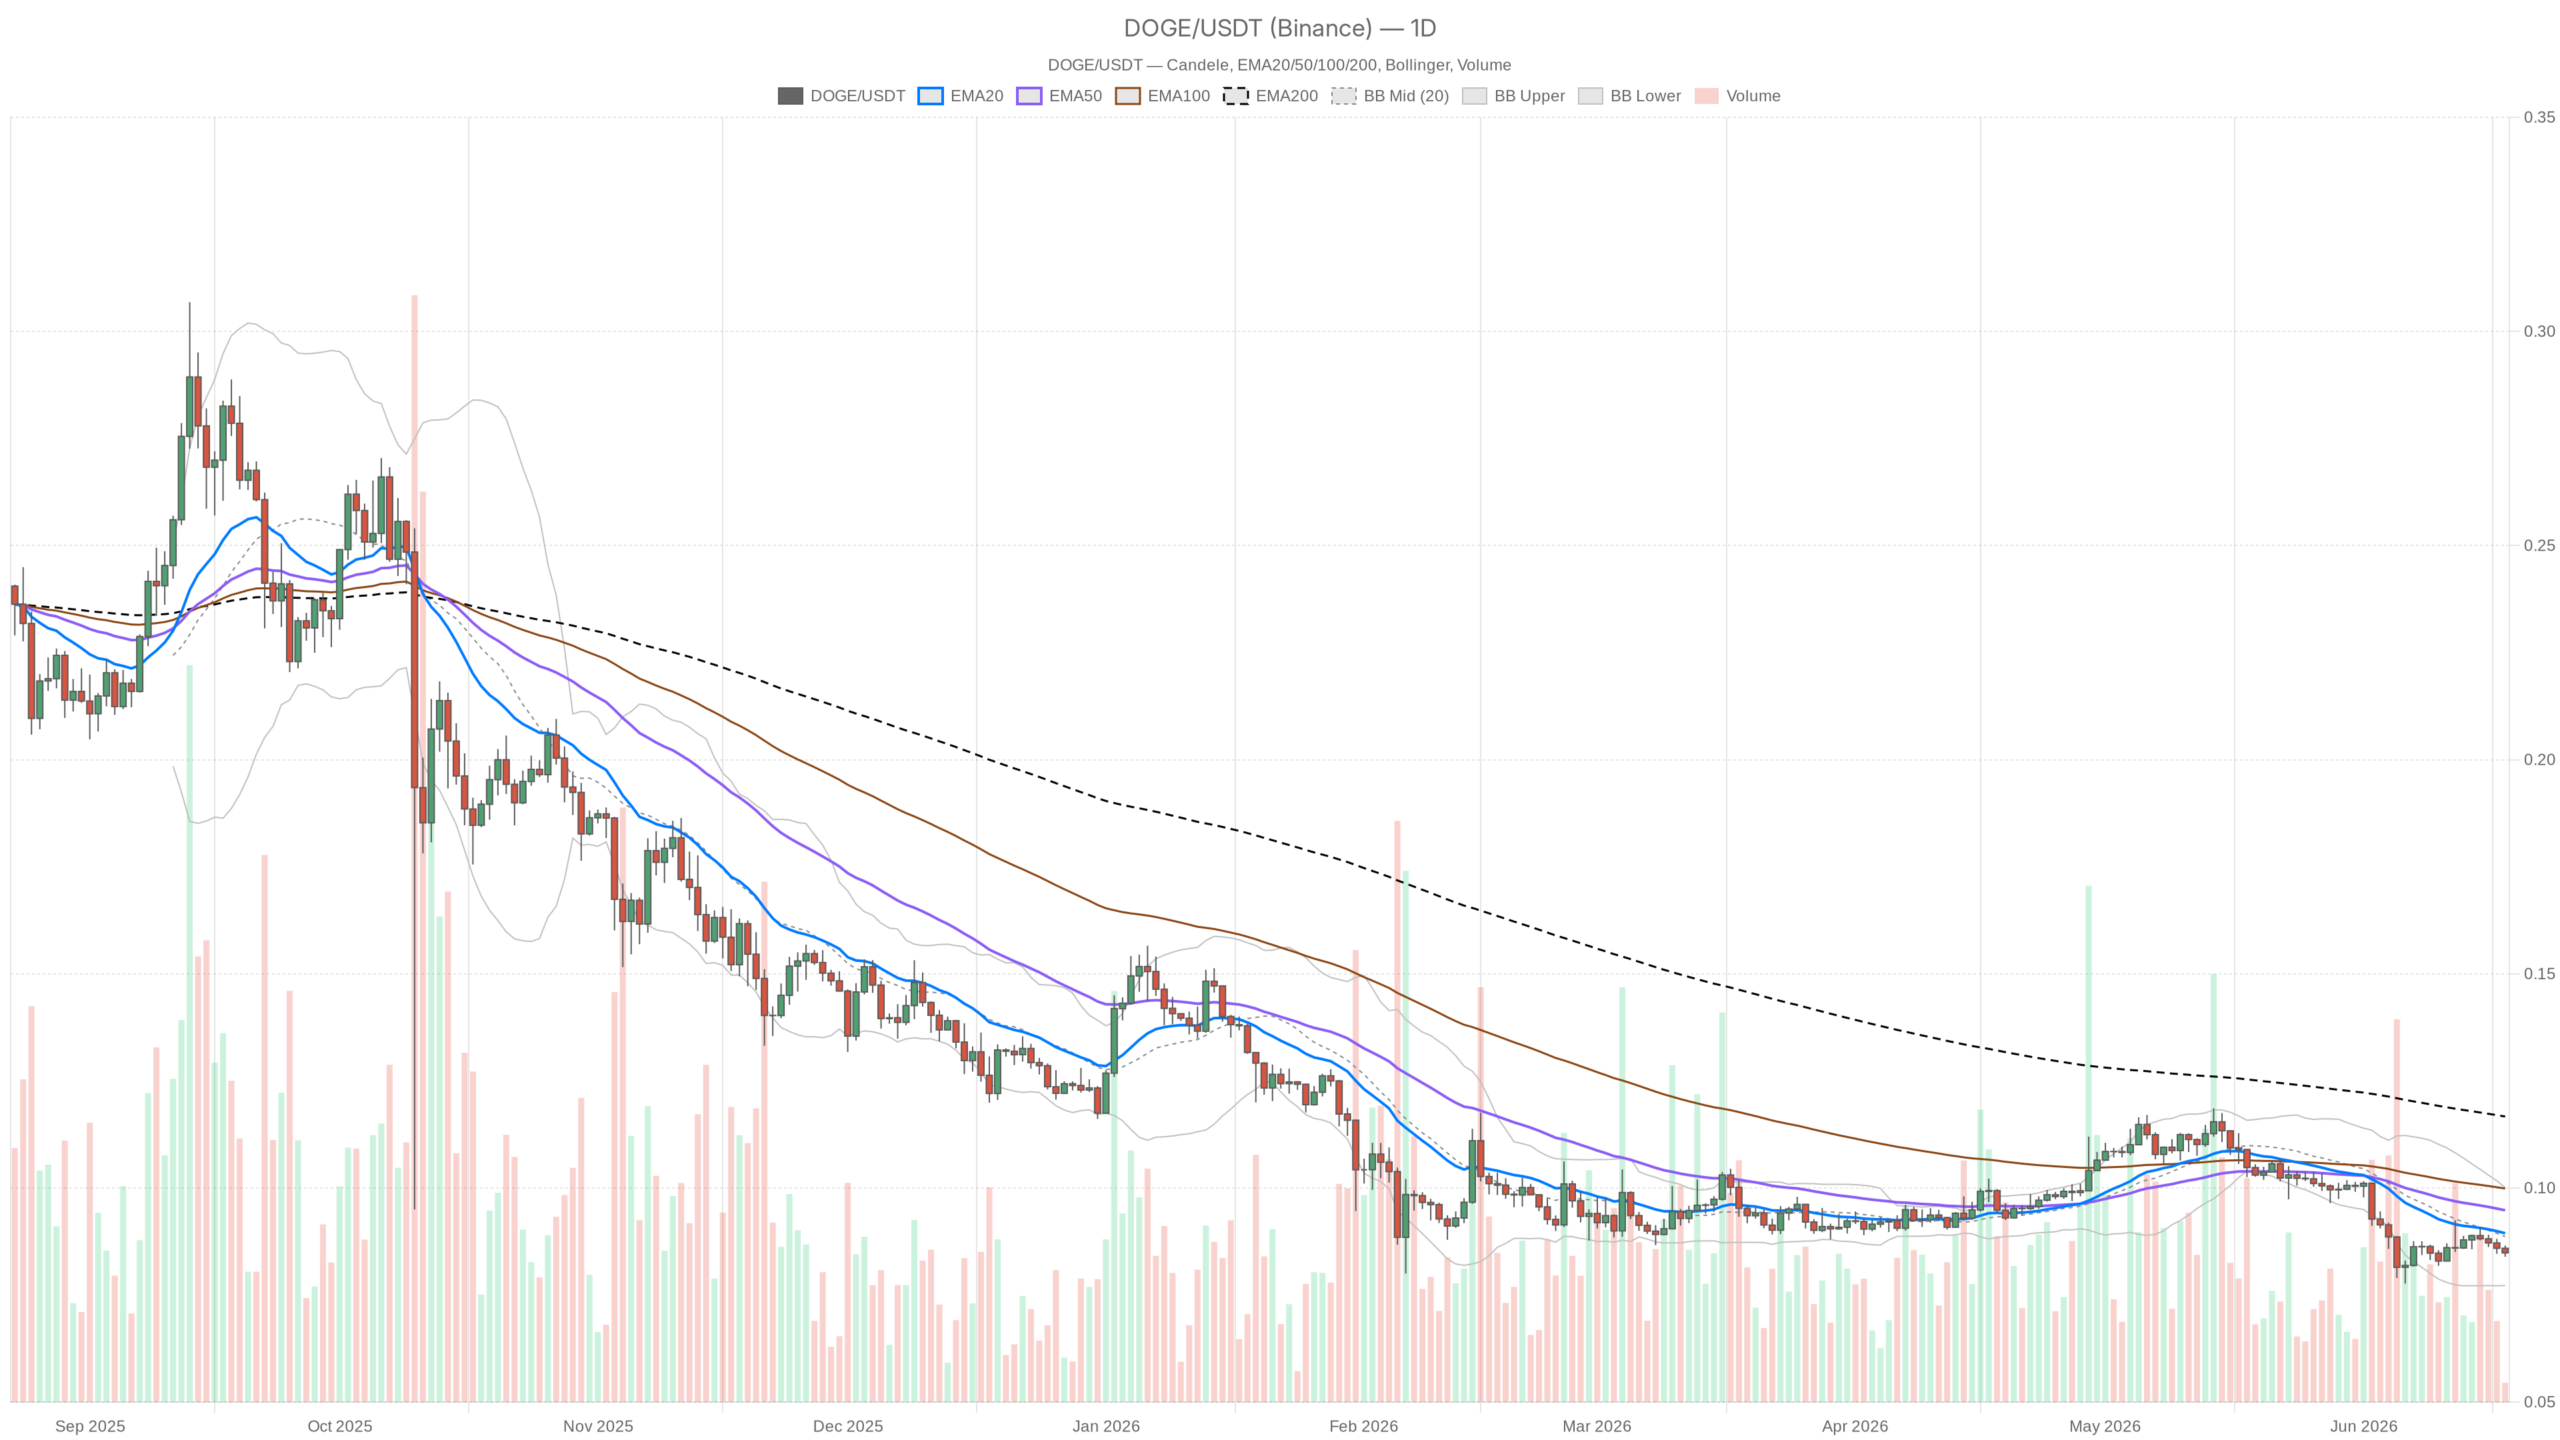
As of mid-June 2026, Dogecoin is drifting lower, hugging its daily Bollinger Band bottom and barely holding the $0.08 level. The dogecoin crypto landscape reflects broader defensive positioning, with total market capitalization around $2.3 trillion and Bitcoin dominance climbing past 56% — capital is fleeing toward perceived safety.
Key takeaways
- DOGE closed at $0.0800, sitting directly on the lower daily Bollinger Band — a zone that historically invites mean-reversion attempts.
- The Fear & Greed Index at 15 signals Extreme Fear, a level that can precede sharp recoveries but also reflects absent buying pressure.
- Multiple resistance levels converge at $0.09 (EMA20, EMA50, Bollinger midline), forming a wall bulls must breach for a credible recovery.
- The EMA200 at $0.12 sits 50% above current price, highlighting the structural damage already sustained.
- A daily close below $0.08 would likely signal the last meaningful floor has given way, opening uncharted territory.
What the Daily Chart Is Actually Telling You
The daily chart signals an unambiguously bearish regime, with DOGE trading at the statistical edge of its recent volatility range. Price closed at $0.0800, sitting right on the lower Bollinger Band at $0.08. However, the midline of those bands sits at $0.09, where both the EMA20 and EMA50 also reside. The convergence of these three levels into a single resistance cluster is not coincidental — every short-term bounce in recent weeks has likely been sold into that zone.
Moreover, the EMA200 looms at $0.12, a full 50% higher than current prices. That gap between price and the long-term moving average is the most telling single data point in this analysis. It reveals how far DOGE has fallen from its trend mean and how much structural damage has been done. Recoveries from this kind of dislocation below the 200 EMA are possible, but they take time and tend to be choppy rather than clean.
The daily RSI at 35.46 sits in near-oversold territory without crossing below 30. That said, it has not generated the kind of signal that triggers systematic buy programs or catches the eye of momentum traders seeking bottoming setups. It is a gray zone: weak enough to confirm real selling, but not distressed enough to flip the narrative toward a genuine reversal. There is room for this number to drift lower before any meaningful floor is confirmed.
Daily pivot analysis from Binance data shows the pivot point and R1 both clustered at $0.09, while S1 sits at $0.08. Meanwhile, price and its primary support level now occupy the same zone, leaving almost zero buffer. A daily close below $0.08 would not just breach a technical level — it would signal that the last meaningful floor has given way.
The Hourly Picture: Confirmation Without Comfort
The 1H chart confirms bearish conditions while adding nuance: no short-term buy-side momentum is accumulating. Price remains at $0.08, still below its EMA20, EMA50, and EMA200 — all converging around $0.09 on this timeframe as well. The 1H RSI at 39.41 is weak but not washed out. If buy-side momentum were building, the hourly RSI would be creeping up ahead of price as an early-divergence signal. That is not happening here.
The 1H Bollinger Bands are tight, with the upper band at $0.09 and the lower at $0.08. Consequently, that kind of compression after a downtrend typically resolves in the direction of the prevailing trend — which is down. It does not have to, but the path of least resistance favors continuation unless something changes structurally.
15-Minute Execution Context
The 15-minute chart offers the least pessimistic reading across all timeframes, suggesting a minor scalp opportunity if $0.08 holds intraday. For anyone actively watching entries or exits, the 15m chart shows the EMA20 at $0.08 — the only timeframe where short-term price structure has not completely broken down. The 15m RSI at 44.81 is the least pessimistic reading across all three timeframes. However, this slightly improved picture would support only a scalp, not a position trade. The macro backdrop does not support anything more aggressive.
Two Scenarios Worth Taking Seriously
Two plausible paths exist: a bounce from $0.08 fueled by contrarian dip-buying, or a structural breakdown with unbounded downside risk. The bullish case rests on one premise: $0.08 holds as hard support, and the Extreme Fear reading acts as a contrarian signal drawing in dip buyers. If DOGE can base at current levels and then clear $0.09, that cluster break would mark a genuine momentum shift. The next target would be around $0.10, with a sustained rally eventually needing to confront the $0.12 EMA200 zone. A daily close below $0.08 with conviction would invalidate this scenario and likely accelerate selling.
The bearish case is, however, more consistent with the evidence. Price sits below every significant moving average on every timeframe. Bitcoin dominance is rising, altcoin appetite remains thin, and DOGE’s chart shows no accumulation pattern, no bullish divergence, and no sign of institutional interest at current levels. A break below $0.08 on volume would represent a structural breakdown, and without a defined lower support level nearby, the move could extend further than most expect. A sharp reversal in broad market sentiment combined with a strong daily close above $0.09 would invalidate this outlook.
Putting It in Context
Dogecoin’s technicals align broadly to the downside, though extreme fear readings have historically preceded sharp recoveries in meme-adjacent assets. The charts are not ambiguous right now — the alignment is bearish across all three timeframes, and the macro environment offers little cover. Nevertheless, the Fear & Greed Index at 15 historically marks a zone of peak pessimism. Peak pessimism can precede sharp, violent recoveries, particularly in assets like DOGE that thrive on narrative shifts rather than fundamentals.
The asymmetry of the current setup is uncomfortable in both directions. The reward for a bounce from $0.08 is real but faces immediate resistance at $0.09, while the risk of a breakdown is effectively unbounded in the short term. For the dogecoin crypto market and its traders, this demands clear-eyed positioning: holding through a bearish continuation requires a specific thesis, not hope, and any bullish positioning here needs a tight invalidation level at $0.08. Markets operating under extreme fear do not reward sloppy risk management.
FAQ
Is Dogecoin likely to recover from current levels?
A recovery is possible if $0.08 holds as support and DOGE clears the $0.09 resistance cluster. However, the technical picture remains bearish across all timeframes, and no accumulation pattern has emerged yet to support a sustained reversal.
What happens if Dogecoin closes below $0.08?
A daily close below $0.08 would signal a structural breakdown of the last meaningful support floor, potentially accelerating selling into territory without clearly defined lower support levels nearby.
Why does the Fear & Greed Index matter for Dogecoin?
At a reading of 15 — deep in Extreme Fear — the index historically marks peak pessimism zones that can precede sharp counter-trend recoveries, especially in sentiment-driven assets like DOGE that lack fundamental anchors.
Disclaimer: This article is for informational purposes only and does not constitute financial advice, an investment recommendation, or a solicitation to buy or sell any financial instrument or cryptocurrency. The analysis provided is not indicative of future results. Investing in crypto assets and financial markets carries a high risk of capital loss. Always do your own research (DYOR) and consult a qualified financial advisor before making any decision.
Article produced with the assistance of artificial intelligence and reviewed by the editorial team.
0
0


 Manage all your crypto, NFT and DeFi from one place
Securely connect the portfolio you’re using to start.

0
0

0
0

0
0

0
0