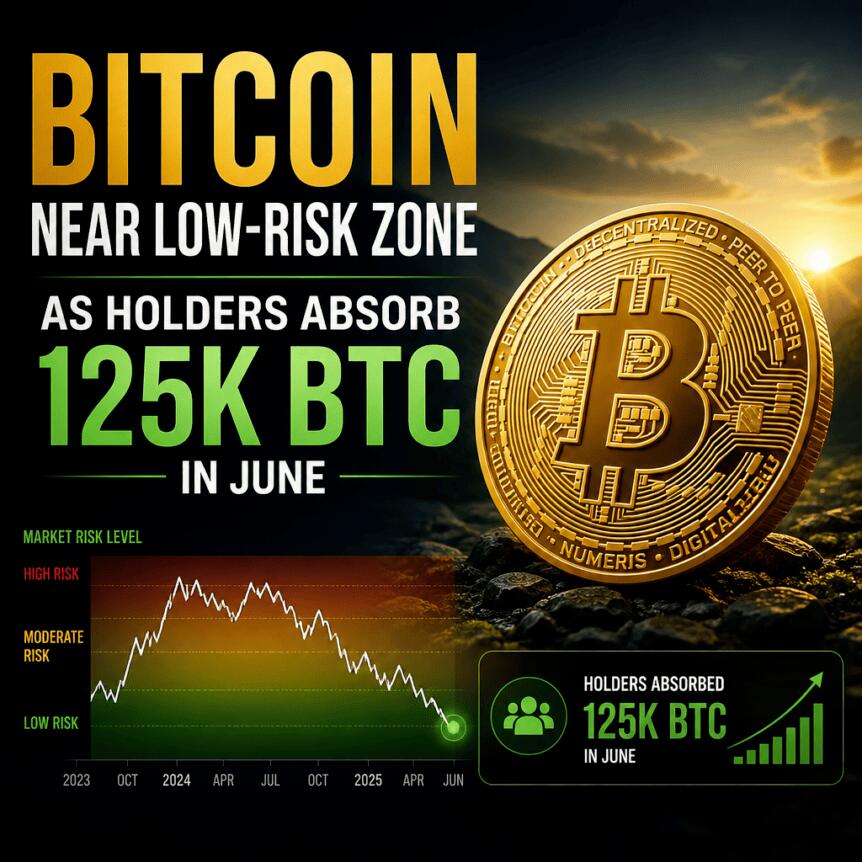
Bitcoin Near Low-Risk Zone as Holders Absorb 125K BTC in June

0
0
Bitcoin’s onchain and risk metrics are pointing toward a renewed accumulation-style phase, with a particularly notable signal emerging from its risk-adjusted return profile. According to CryptoQuant data, Bitcoin’s Sharpe ratio — a measure that compares returns to volatility — has fallen back toward the -20 zone that has historically lined up with major market bottoms.
At the same time, exchange balances have continued to drift lower, while wallets identified as “accumulator” addresses have shown stronger absorption behavior in early June, suggesting that supply leaving trading venues is increasingly being taken up rather than sitting idle.
Key takeaways
- CryptoQuant reports Bitcoin’s Sharpe ratio returning to -20 on June 11, a threshold that has appeared around major cycle lows in past bear markets.
- Exchange reserves have declined by roughly 80,000 BTC since February, with balances around 2.71 million BTC as of Monday.
- Accumulator address demand has risen sharply in early June, with CryptoQuant showing absorption of about 125,000 BTC between June 1 and June 14.
- Bitcoin remains below its 100-week simple moving average (SMA) for 133 straight days, and prior cycles suggest this can persist for additional months.
Sharpe ratio signals a bottom-aligned risk regime
CryptoQuant data shows Bitcoin’s Sharpe ratio reached -20 on June 11. The metric first slipped below that level on Jan. 5, 2015, and stayed there until June 12, when Bitcoin formed what the source describes as a durable bottom and moved into a recovery phase.
Similar behavior has played out in other drawdowns. From Dec. 8, 2018 through March 7, 2019, the Sharpe ratio remained under -20 for much of the bear market floor. The same pattern also appeared from Oct. 7, 2022 through Jan. 7, 2023, before Bitcoin transitioned into its next sustained bullish stretch.
Importantly, the article’s underlying data-driven claim is not that -20 precisely predicts the exact day a bottom occurs. Instead, periods when the Sharpe ratio spends time below -20 have tended to coincide with prolonged accumulation behavior — a dynamic where risk-adjusted returns look unfavorable but supply is gradually absorbed.
Exchange reserves down as accumulator wallets absorb more BTC
Onchain balance movements reinforce the risk-metric story. The analysis notes that BTC held on exchanges fell to 2.71 million on Monday, down from 2.79 million BTC in February. While exchange reserves briefly bounced to 2.73 million BTC from a late-April/early-June low of 2.65 million BTC, the source says balances have since dropped again by about 12,000 BTC over the past two weeks.
In other words, the supply available on trading venues did not simply stabilize after a brief rebound — it has continued to thin. That matters because persistent outflows from exchanges often align with less immediate selling pressure, especially when those coins are not immediately reintroduced into markets.
CryptoQuant’s “accumulator” cohort further supports that interpretation. The analysis says these accumulator addresses absorbed 125,000 BTC between June 1 and June 14. It also highlights an earlier comparison from the first two weeks of June: demand from accumulator wallets reportedly rose to 240,000 BTC from 115,000 BTC across that period, indicating that absorption accelerated rather than staying flat.
While exchange reserve decreases can be driven by many factors, the presence of stronger absorption from long-term-leaning wallets typically suggests coins are being retained. The source frames this as growing interest from wallets with a history of holding rather than distributing.
Staying under the 100-week SMA: consolidation may take time
Beyond onchain metrics, the current chart structure also fits a “build-up before trend resumption” narrative. The analysis states that Bitcoin has spent 133 consecutive days below its 100-week simple moving average (SMA). At the time of writing, that 100-week SMA is near $88,466, according to the source’s referenced calculation.
Historically, Bitcoin has often traded below the 100-week SMA for extended periods before reclaiming it. After the 2013 peak, BTC spent 378 days under the indicator while consolidating between $200 and $400. During the 2018–2019 bear market, Bitcoin remained below the 100-week SMA for 175 days and traded in a $3,000 to $6,000 range.
The longest stretch cited by the source occurred after the 2022 decline. In that cycle, Bitcoin stayed below the 100-week SMA for 532 days while trading between $16,000 and $25,000. Averaging across the three examples provided, Bitcoin spent roughly 362 days under the 100-week SMA before reclaiming it and establishing a more sustained uptrend, with those periods described as prolonged accumulation rather than immediate recoveries.
Given that the current cycle has logged 133 days below the 100-week SMA, the analysis argues that the market may still be early in a longer consolidation process. Prior examples suggest that reclaiming the trendline often comes months after the initial breakdown phase, not immediately.
What to watch next for confirmation
For investors and traders, the most important question is whether the current clustering of signals persists: the Sharpe ratio hovering around the -20 zone, continued declines in exchange reserves, and ongoing absorption by accumulator addresses. The longer Bitcoin remains under the 100-week SMA, the more likely this resembles a multi-month accumulation cycle rather than a quick mean-reversion bounce — but confirmation will depend on whether these metrics stabilize into a clear shift rather than fading back.
This article was originally published as Bitcoin Near Low-Risk Zone as Holders Absorb 125K BTC in June on Crypto Breaking News – your trusted source for crypto news, Bitcoin news, and blockchain updates.
0
0

 Manage all your crypto, NFT and DeFi from one place
Securely connect the portfolio you’re using to start.

0
0

0
0

0
0

0
0