Polygon (MATIC) Price Reclaims $0.60 Level After Team Announces Two New Upgrades
7M ago•

bullish:
0
bearish:
0
Share

The Polygon (MATIC) price has increased since September 11 and broke out from a descending resistance trendline on September 19.
The price reclaimed the $0.60 horizontal resistance area shortly after the breakout. Is this the beginning of the trend reversal?
MATIC Reclaims Horizontal Resistance
The daily timeframe technical analysis shows that MATIC has increased since September 11 and broke out from a descending resistance trendline on September 29.
Transform your crypto game with predictive MATIC insights. Visit now.
After initially struggling to increase above the $0.60 horizontal resistance area on October 4 (red icon), the MATIC price created a higher low on October 19. It broke out three days later.
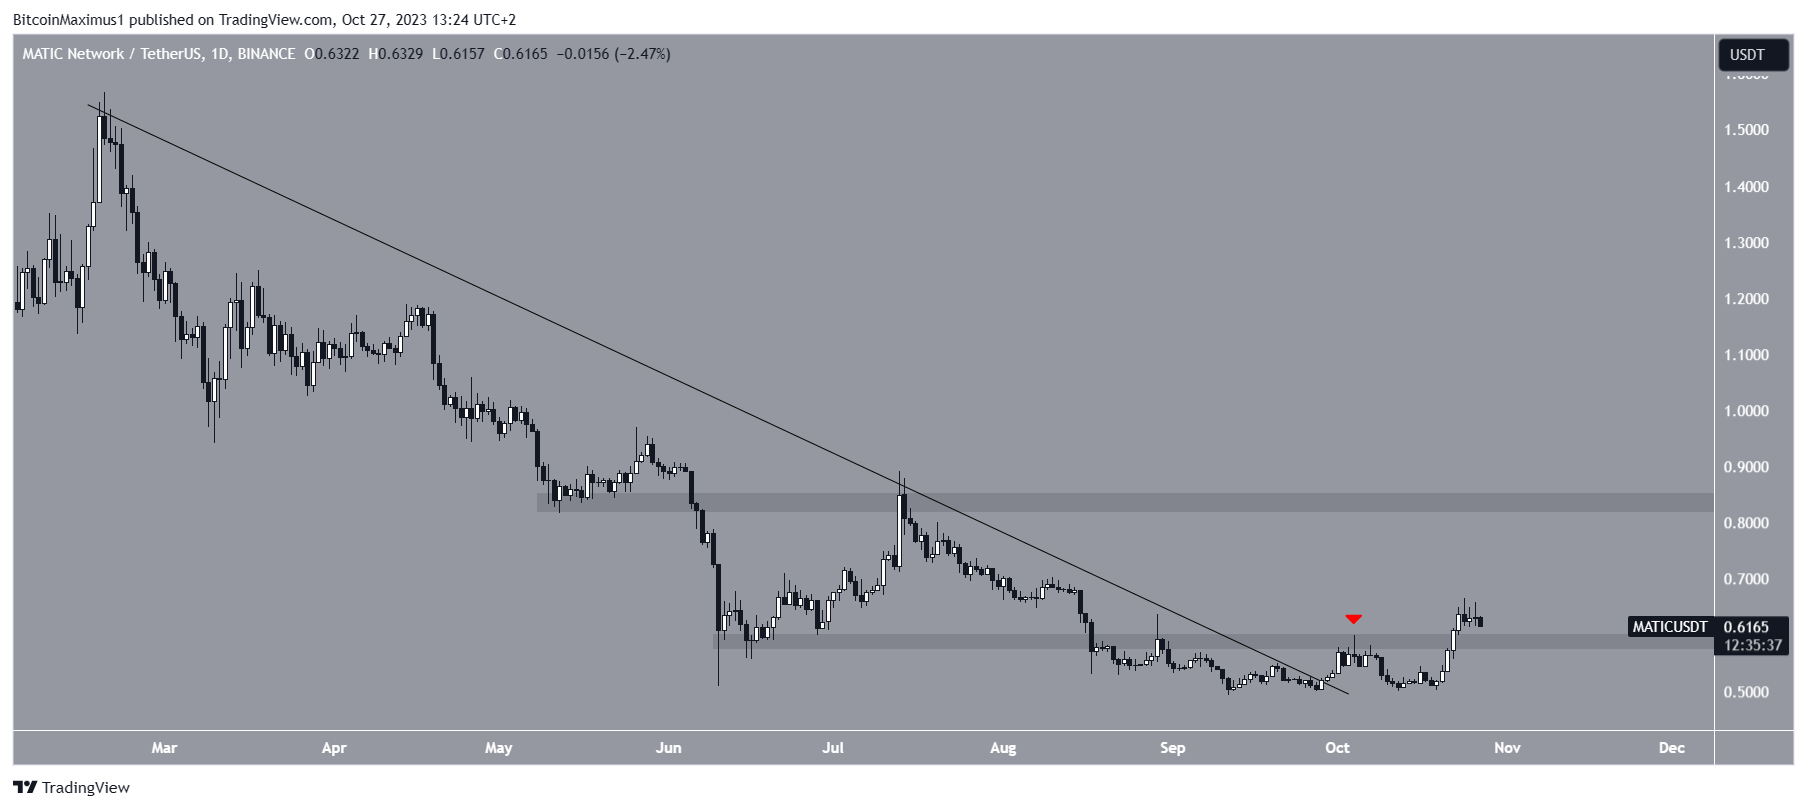 MATIC/USDT Daily Chart. Source: TradingView
Polygon announced that it is releasing a new version of the Miden Virtual Machine, expected to improve its performance by 30%. The Polygon team also announced that they were triggering the 10-day timelock of the Inca Berry, the newest upgrade of the Mainnet.
The Binance exchange also announced the launching of a new trading service using the USDC stablecoin on its native Polygon blockchain.
MATIC Price Prediction: Has the Trend Reversal Started?
The weekly timeframe technical analysis provides a bullish outlook, supporting the ongoing breakout from the resistance trendline.
In September, the MATIC price fell below the long-term $0.60 horizontal area. However, that was only a deviation (green circle) since the price reclaimed the area shortly afterward.
Besides the deviation, MATIC also created a bullish, engulfing candlestick last week (green icon).
Read More: Best Crypto Sign-Up Bonuses in 2023
This is a type of bullish candlestick when the entire decrease from the previous period is negated in the next one. It further adds validity to the breakout and reclaim of the horizontal area.
If the MATIC price continues increasing, the next resistance will be at $0.85, 40% above the current price.
Due to the reclaim of the horizontal level, cryptocurrency trader Crypto_Scient believes that MATIC will reach this resistance.
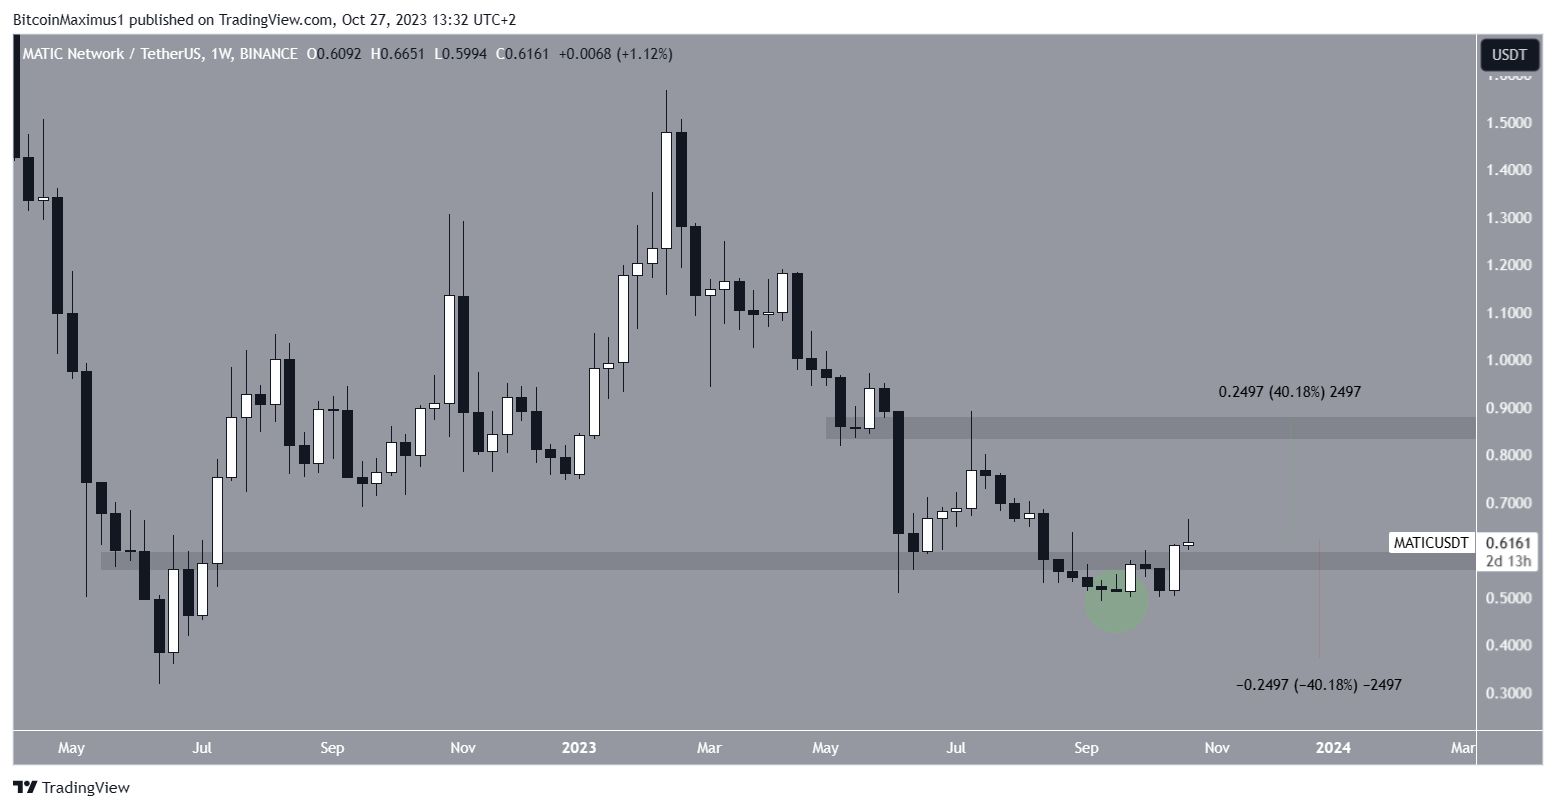 MATIC/USDT Weekly Chart. Source: TradingView
Despite this bullish MATIC price prediction, a weekly close below the $0.60 horizontal area will invalidate the breakout.
If this happens, it can cause a 40% price decrease to the June lows at $0.35.
Interested in AI Trading? 9 Best AI Crypto Trading Bots to Maximize Your Profits
7M ago•
bullish:
0
bearish:
0
Share


 Manage all your crypto, NFT and DeFi from one place
Securely connect the portfolio you’re using to start.

bullish:
0
bearish:
0

bullish:
0
bearish:
0


bullish:
0
bearish:
0