Polkadot Price Soars 3% Despite the SEC Postponing the DOT ETF – Bulls Eye $5
0
0

Highlights:
- Polkadot price spikes 3% to $4.31, as trading volume soars 42%.
- M2 global liquidity Index spikes to 97.3, indicating an increase in available capital.
- On-chain metrics show a surge in OI and volume, signalling further upside potentially to $5.
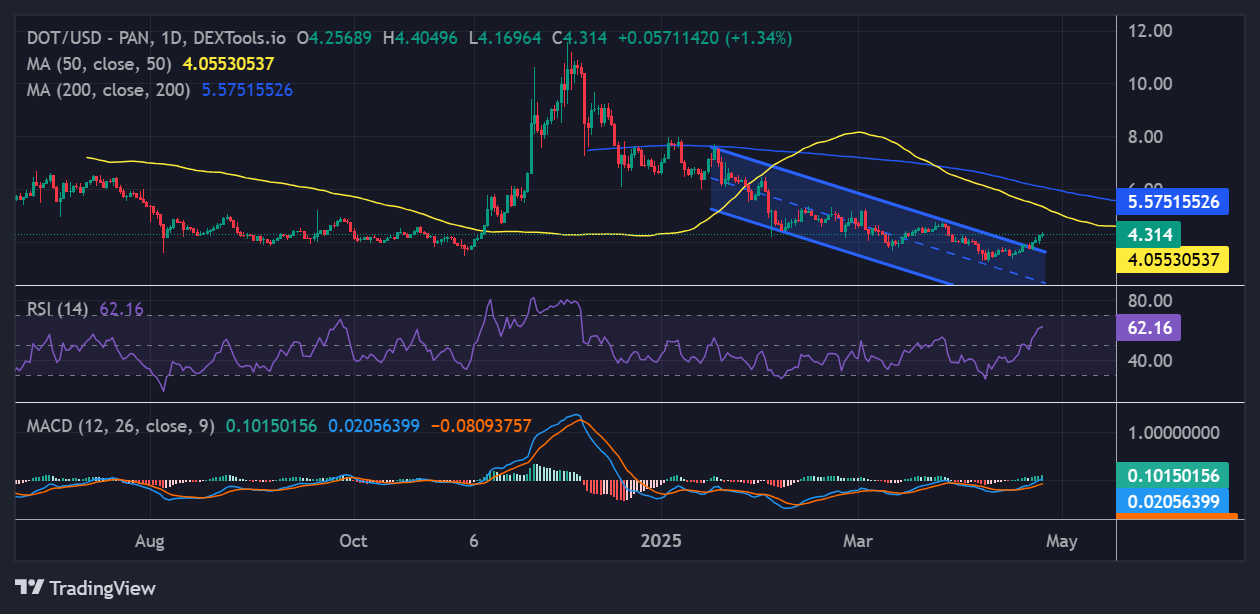
The Polkadot price has sparked a slight upward movement, soaring 3% to the $4.31 mark. Buyers are showing immense strength, as they have flipped the $4.05 into a support level. With the recent rally, can DOT price reclaim the $5.57 mark?
Meanwhile, the US Securities and Exchange Commission (SEC) has postponed its decision on the DOT ETF. The SEC is reviewing the application to launch the ETF and the subsequent decision till June 1. Moreover, the M2 Global Liquidity Index spiked to 97.3, indicating an increase in the available capital.
Global Liquidity Watch!
The global M2 money supply is climbing again.
Now at ~$110T.
But the real signal is in the annual change in M2.
After the steepest liquidity contraction in decades, we're once again back in positive territory. pic.twitter.com/qMvVQWVRof
— Leon Waidmann
(@LeonWaidmann) April 25, 2025
All these factors could contribute to Polkadot’s long-term outlook. Let’s examine the DOT technical outlook.
Polkadot Price Outlook
A closer look at the DOT daily chart shows that the Bulls are attempting to gain dominance, which may spike a rally toward $5 in the short term. Moreover, the 50-day MA at $4.05 acts as the immediate support area, giving the bulls hind wings for a potential surge.
If the key support level holds, and the market sentiment remains positive, the Polkadot price could rally toward $4.70. A breach above this level will open the gates for more upside towards the $5.57 resistance mark, bolstering the bullish outlook.

The Polkadot technical indicators show a potential for an upward trajectory. A zoomed-out outlook at the Relative Strength Index sits at 62.16, above the 50-mean level. This shows that the buying activity is surging, tilting the odds towards the bulls. Meanwhile, the DOT token still has more room for the upside before it is considered overbought. On the other side of the fence, the MACD momentum indicator upholds a buy signal. This shows a bullish sentiment, calling for traders to buy more DOT.
On the flip side, if investors start booking tier profits early, the Polkadot price could fall. In such a case, the $4.11 support area will act as a safety net. If the support level gives way, the DOT price could dwindle deeper toward $4.05, $4.01, and $3.87.
CoinGlass Data Indicates a Rise in OI and Volume: Is a Rally to $5 Imminent?
Meanwhile, Coinglass data shows potential further upside in the Polkadot market. The DOT Derivatives data analysis shows a spike in open interest (OI) by 7% to $402.96M. On the other hand, the volume has soared 21% to $467.20M. In other words, this shows that new money is flowing to the Polkadot market, which may cause a spike in Polkadot prices.

The recent developments in Polkadot indicate a potential rally in the near future. Moreover, with the positive market sentiment, with Bitcoin price breaking above $94K, the DOT bulls could gain strength. In the meantime, traders should observe the increasing trading volume and significant support and resistance key levels to determine Polkadot’s next move. A breach above $5.57 will unlock the gates for further upside.
Best Crypto Exchange
- Over 90 top cryptos to trade
- Regulated by top-tier entities
- User-friendly trading app
- 30+ million users
eToro is a multi-asset investment platform. The value of your investments may go up or down. Your capital is at risk. Don’t invest unless you’re prepared to lose all the money you invest. This is a high-risk investment, and you should not expect to be protected if something goes wrong.
0
0
 Manage all your crypto, NFT and DeFi from one place
Securely connect the portfolio you’re using to start.


