
Chainlink Price Prediction 2030: Can LINK Reach $200?

0
0

$LINK is trading around $7.91 right now, sitting back inside its old monthly accumulation area after getting rejected from a long descending trendline.
Working out where this token goes next means understanding this area properly before making any Chainlink price prediction 2030 calls.
Chainlink currently ranks 18th among all cryptocurrencies, holding a market cap close to $5.92 billion and a fully diluted value of $7.91 billion, out of a total supply of 1,000,000,000 tokens, with 748,099,970 LINK already in circulation.
This Chainlink coin price prediction leans on the same accumulation area and trendline structure to work out what happens next.
Chainlink Price Right Now
Metric | Value |
$7.91 | |
Market Cap | $5.92B |
24H Volume | $221.87M |
Circulating Supply | 748,099,970 LINK |
Total Supply | 1,000,000,000 LINK |
Chainlink Chart Structure Right Now
On the monthly chart, LINK has come straight back into the same accumulation area it built between May 2022 and September 2023.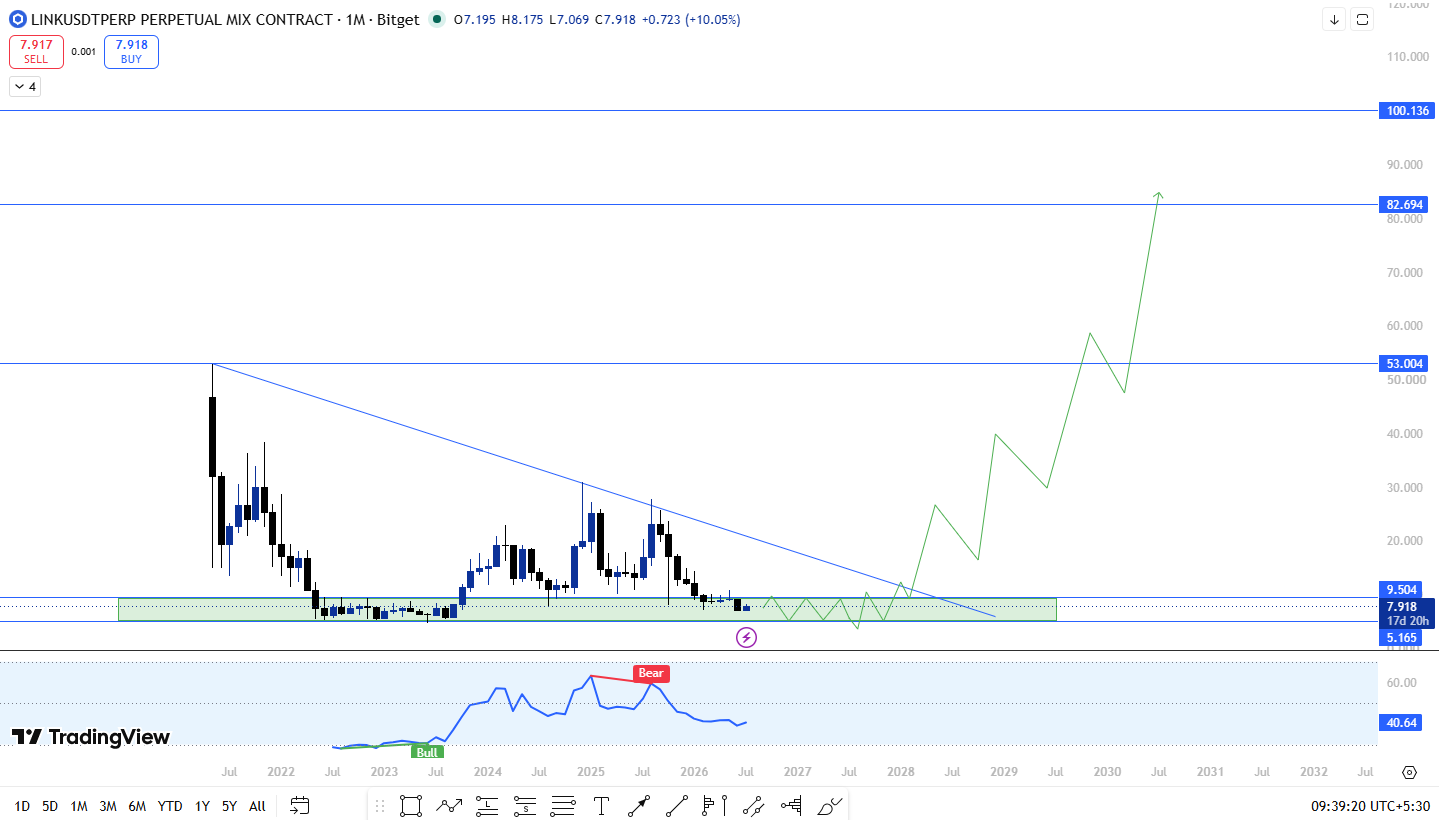
That zone held for well over a year, and once LINK finally broke out of it, the token delivered more than 550 percent returns from that base.
That run shows exactly how powerful this zone has been in the past.
After that big rally, LINK ran into a long descending trendline that has been dragging price down since the 2022 top.
It pushed up against that trendline, got rejected, and has now slipped back down into the same accumulation zone it started from.
Price is currently sitting right inside that range again, which puts LINK at a familiar spot on the chart.
This kind of setup, where a coin returns to a zone that already proved itself once, tends to draw fresh accumulation from buyers who remember what happened last time.
If LINK manages to sustain here and eventually clears that descending trendline again, the setup opens up room for a much bigger move, and at that point the sky is the limit for how far aggressive buying can push this LINK price prediction for 2030.
What This Setup Means Going Forward
Right now, the main job for LINK is to hold this accumulation area and build a proper base, the same way it did between 2022 and 2023.
Markets that repeat a proven structure like this often attract steady buying rather than sharp, unstable moves.
If $LINK holds this zone and eventually breaks above the descending trendline with strength, the door opens for a real trend change.
Given how the last breakout from this same area played out, this Chainlink price prediction sees real potential once that trendline finally gives way, since aggressive buying tends to follow strong trendline breaks like this.
If the area fails to hold instead, $LINK would likely need more time inside this range before any breakout attempt becomes realistic again.
Support and Resistance Levels
The accumulation area itself, roughly between $5.16 and $9.50, is the main support area to watch, since this is the exact range that built the base for LINK's last major rally.
On the upside, the descending trendline remains the key resistance, and clearing it is what would confirm the next leg of this Chainlink price forecast.
Chainlink Price Prediction (Year-Wise)
Timeframe | Scenario | Min Target | Max Target | Key Trigger |
2026 | Bearish | $5.16 | $9.50 | LINK stays inside accumulation zone; trendline resistance holds |
2026 | Bullish | $9.50 | $20.00 | Zone holds; early push toward trendline resistance begins |
2028 | Bearish | $9.50 | $40.00 | Slow grind, repeated tests of trendline before real breakout |
2028 | Bullish | $40.00 | $70.00 | The trendline breaks with strength; aggressive buying kicks in |
2029 | Bullish | $70.00 | $150.00 | Breakout sustains; LINK builds toward higher trend targets |
2030 | Bullish | $150.00 | $200.00 | Trend continuation holds; LINK pushes into new high territory |
Risk and Reward: The Honest Version
Factor | Bull Case | Bear Case |
Accumulation Zone ($5.16 to $9.50) | Holds, repeats the same base that led to 550%+ returns before | Breaks down, LINK needs a fresh lower base |
Descending Trendline | Finally breaks with strength, opens the door toward $150 and beyond | Rejects again, price stays capped inside the zone |
The analysis above combines historical price structure with publicly available market data and should not be treated as a guarantee of future performance.
Invalidation Level
This entire setup depends on the accumulation zone holding, roughly the $5.16 area on the lower end.
A close below this zone would invalidate the current bullish structure, and in that case LINK would likely need to build a fresh base lower down before any real attempt at the descending trendline becomes realistic again.
Expert View
Analysts tracking Chainlink point out that this is not the first time LINK has built a base inside this exact accumulation zone, and the last time it happened, the breakout led to a run of more than 550 percent.
That history is why many are watching this current retracement closely, since a repeat of that structure could set up another strong move once the descending trendline finally breaks.
Most agree that patience here matters more than chasing short-term moves, since this kind of setup tends to reward buyers who accumulate steadily rather than those looking for quick swings.
Sentiment around the broader market, including the fear and greed index, is also being tracked alongside this setup for added context.
Conclusion
$LINK's chart comes down to one repeating structure right now, the same accumulation zone that built its last major rally, now being tested again after a rejection from the descending trendline.
If this zone holds and the trendline eventually breaks, this Chainlink price prediction sees a realistic path toward $150 by 2029 and $180 to $200 by 2030.
If the zone fails, $LINK likely needs more time to rebuild before any fresh push higher.
Keeping an eye on other major crypto price predictions can also help put this setup into broader market context.
Disclaimer: This article is for informational purposes only and should not be considered financial advice. Cryptocurrency markets are highly volatile, and price predictions are not guaranteed. Please do your own research before making any investment decisions.
0
0

 Manage all your crypto, NFT and DeFi from one place
Securely connect the portfolio you’re using to start.

0
0

0
0

0
0

0
0