
XRP Price Prediction: Can XRP Hit $3 Soon If the Bull Market Returns?

0
0

XRP has spent the past month going nowhere fast. After the explosive August rally from $1 to almost $1.70, the XRP price has been grinding sideways around $1.50, trapped inside a second falling wedge while the rest of the market waits for direction. Boring, yes, but this is exactly the kind of structure that tends to resolve with a sharp move. In this XRP price prediction we look at where the price stands today, what the chart is telling us, and how XRP could realistically climb to $3 if the crypto bull market comes back.
Where Does the XRP Price Stand Right Now?
At the time of writing, XRP trades at $1.48 on the daily chart, just below the $1.50 line that has acted as the pivot for the whole of September. The 200-day EMA sits at $1.37 and is finally curling upward after months of pointing down, which is the first time since spring that the long-term trend indicator is on the bulls' side.
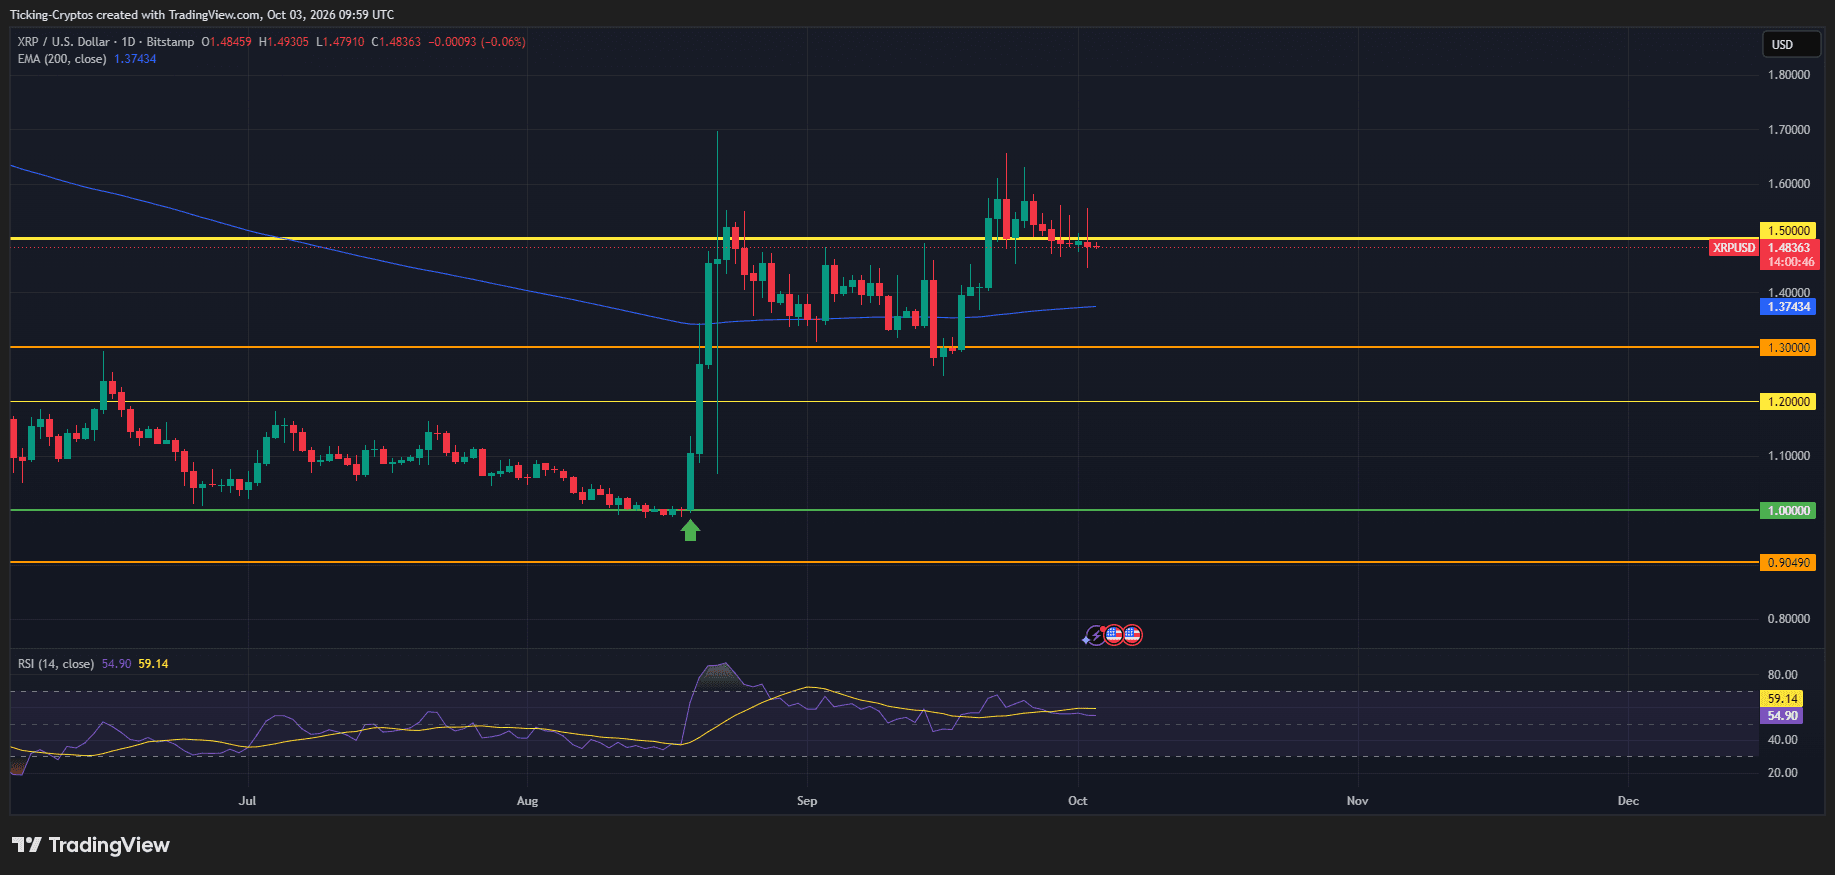
The bigger picture matters here. XRP bottomed right at the $1.00 psychological level in late August, bounced hard, and printed a vertical candle straight into $1.70. That move was too fast to hold, and the price has since been digesting it in two consecutive falling wedges. The first wedge broke to the upside in mid-September and sent XRP back to $1.65. The second one is forming right now, with the price pressed against the upper trendline.
Momentum is neutral rather than weak. The daily RSI sits at 55, well off the overbought spike above 80 from August, and has carved out a series of higher lows while the price moved sideways. That is quiet accumulation behavior, not distribution. You can follow the live XRP price on our crypto prices page.
What Does the XRP Chart Say About the Next Breakout?
The setup is a textbook falling wedge inside an uptrend, which is a bullish continuation pattern. Lower highs are compressing the price against the $1.50 pivot while the lows are flattening around $1.40 to $1.45. The wedge projects down toward $1.20 if it ran to completion, but these patterns usually break before the apex, and the last one did exactly that.
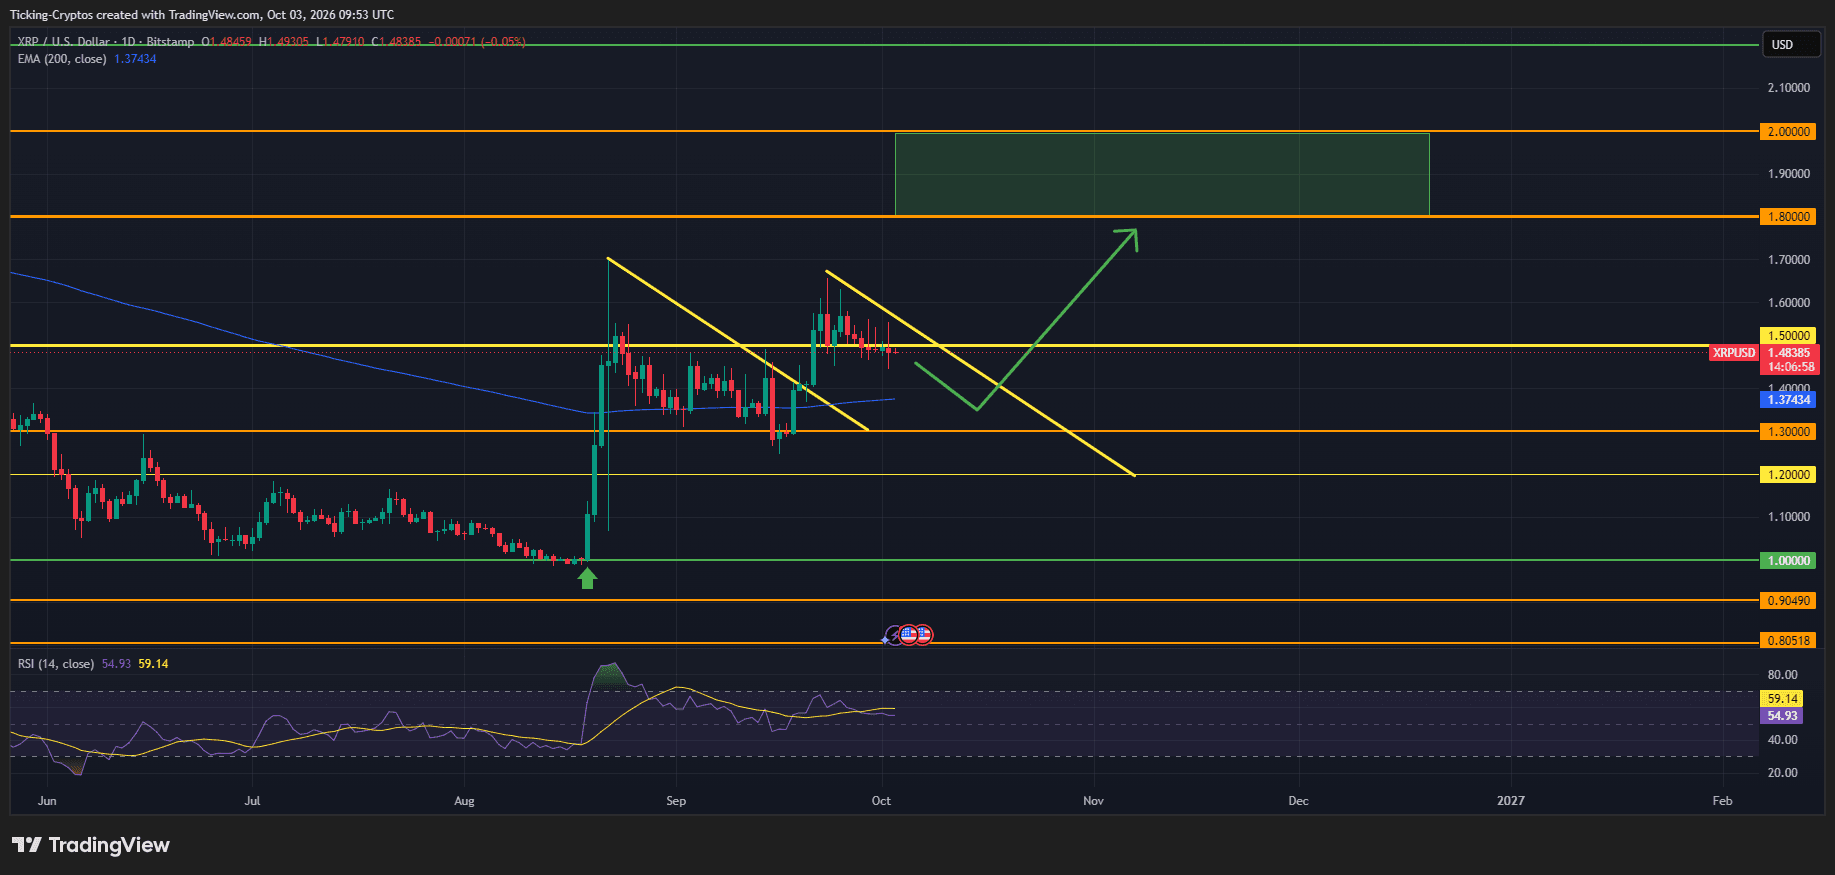
Our base case for the coming weeks: one more shakeout first. A dip toward the 200-day EMA at $1.37, possibly a brief wick into the $1.30 support, would flush out late longs and reset funding before the real move. From there, a daily close above the wedge's upper trendline and the $1.50 pivot would confirm the breakout.
The first target after a breakout is the $1.80 to $2.00 zone, marked as the green box on both charts. This is a heavy area: $1.80 is the first major resistance since the August spike, and $2.00 is the round number every trader is watching. Expect the first attempt to fail and the price to chop between $1.80 and $2.20 for several weeks, roughly through November and December, before the next leg.
If the price breaks down instead and loses $1.30 on a daily close, the bullish wedge is invalidated and the next stops are $1.20 and the $1.00 floor. Until that happens, the structure favors the upside.
Can XRP Reach $3 If the Bull Market Comes Back?
Yes, but not in a straight line, and not without help from the broader market. $XRP rarely leads; it tends to lag Bitcoin for weeks and then catch up violently. So the $3 XRP price prediction only plays out if $Bitcoin reclaims its highs and risk appetite returns to altcoins. If that happens, the chart gives us a clear roadmap with four stages:
- Stage 1: Break the wedge, reclaim $1.50. A daily close above the trendline flips the September range into support. Target: the $1.80 to $2.00 box, likely by November.
- Stage 2: Build a base between $1.80 and $2.20. Two or three failed attempts at $2.00 and $2.20 are normal here. The key is that every pullback holds above $1.80, turning the old resistance box into a launchpad. This phase probably eats up the rest of 2026.
- Stage 3: Clear $2.20 and run to $2.75. Once $2.20 goes, there is very little historical structure until $2.75, so this leg could be fast. The $2.75 level is the last meaningful resistance before the big round number.
- Stage 4: The $3 test. $3.00 is both a psychological magnet and the area where XRP topped in previous cycles. A first touch early in 2027 is realistic in a full bull market; a clean break above it would need genuine euphoria.
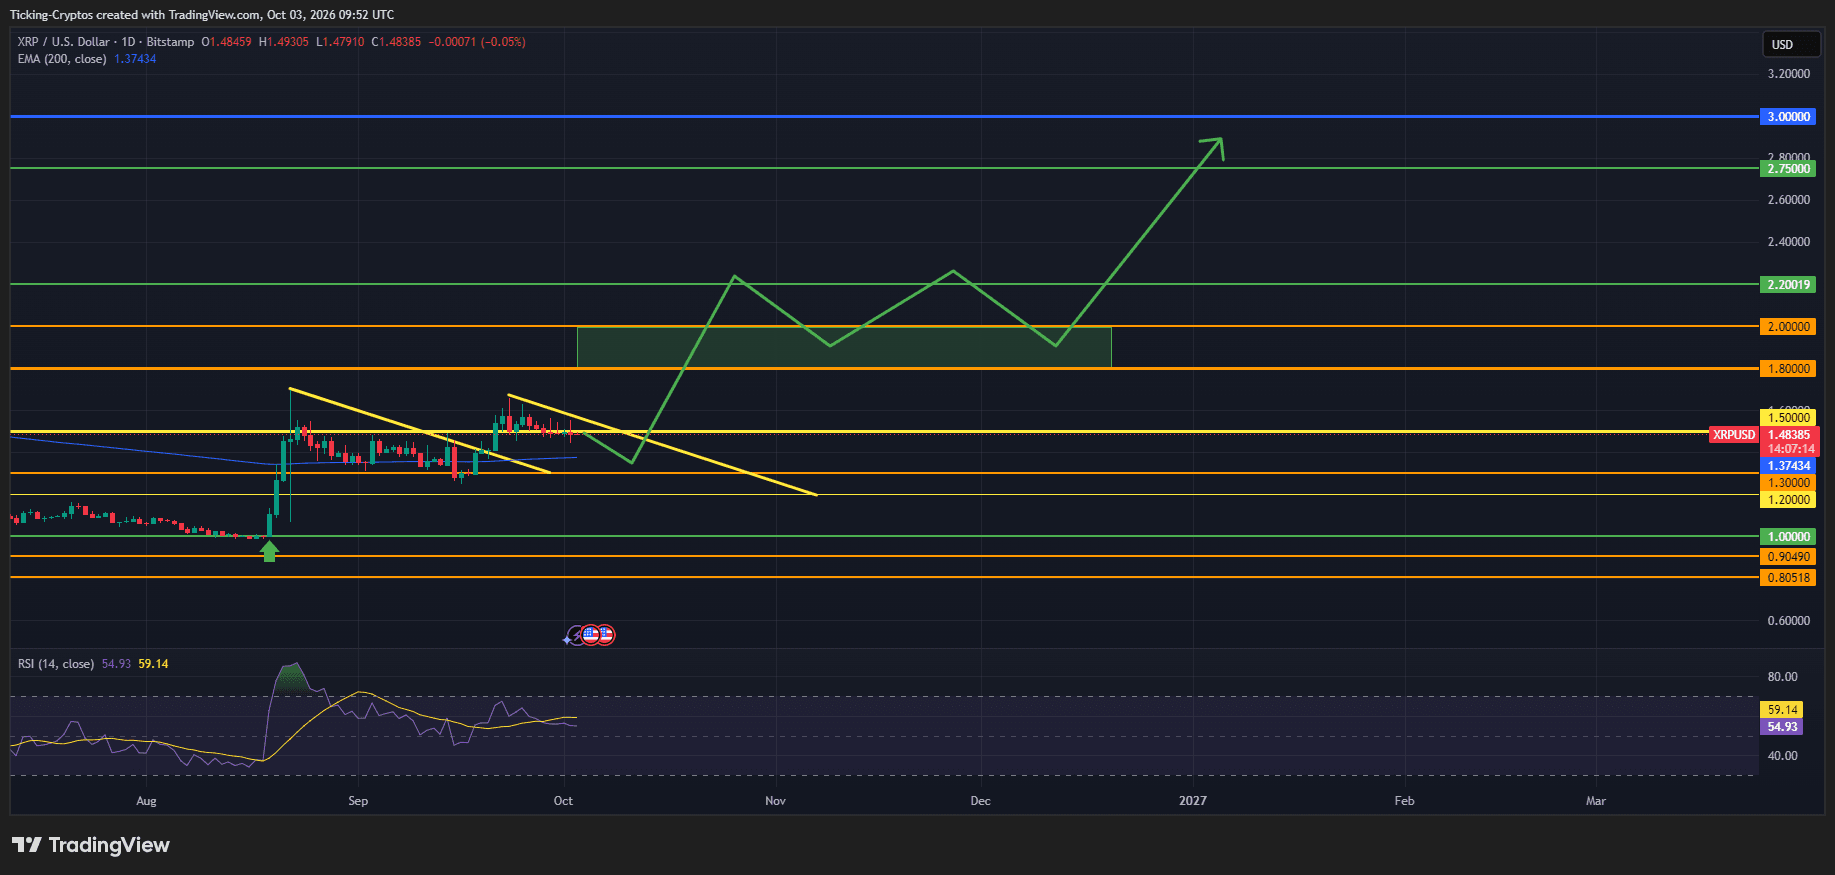
The arrow on our long-term chart sketches exactly this path: a shakeout to $1.37, a breakout to $2.20, a long consolidation between $1.80 and $2.20, then the final push to $2.75 and $3.00 around the turn of the year. From today's price, $3 is roughly a doubling. Ambitious, but XRP went from $1 to $1.70 in two weeks in August, so the volatility to get there clearly exists.
What Could Derail the XRP Price Prediction?
The obvious risk is that the bull market simply does not come back. XRP's chart looks constructive, but it is a relative call: if Bitcoin rolls over, no wedge in the world will carry XRP to $3. Watch the total crypto market cap and Bitcoin dominance on our market charts alongside the XRP chart itself.
On the XRP chart, these are the levels that matter on the downside:
- $1.37: the 200-day EMA. A dip here is healthy and part of our base case.
- $1.30: the September low and first real support. Losing it on a daily close invalidates the bullish wedge.
- $1.20: the wedge's full downside projection and the last line before the round number.
- $1.00: the August bottom and the level that started this whole move. A return here would mean the August rally was a one-off spike, not the start of a new trend.
- $0.90 and $0.81: deeper supports from the summer range, only in play in a full market breakdown.
The practical takeaway: the $3 XRP price prediction is a conditional one. The chart says the structure is ready and the trend indicators are turning. The macro backdrop has to do the rest. As long as XRP holds above $1.30 and the broader market finds its footing, the path to $2, $2.75 and eventually $3 stays open.
0
0

 Manage all your crypto, NFT and DeFi from one place
Securely connect the portfolio you’re using to start.


