
Cardano Price Prediction Today: ADA Eyes Next Move

0
0

$ADA is trading around $0.1639 right now, up over 4% today, after breaking out of a multi-week descending channel.
This Cardano price prediction looks closely at the trendline rejection pattern that shaped ADA over the past few weeks, along with fresh whale accumulation data.
Together, the chart structure and this heavy buying from large holders give a clearer picture of where ADA could head next.
Cardano Price Right Now
Metric | Value |
Current Price | $0.1639 |
Market Cap | $5.96B |
Futures Volume (24H) | $485.22M |
Spot Volume (24H) | $80.55M |
Open Interest | $392.72M |
Circulating Supply | 36.47B ADA |
Total Supply | 44.99B ADA |
Max Supply | 45.00B ADA |
Cardano News Today
According to a tweet from BSCN, wallets holding at least 1 million ADA now control 25.1 billion tokens, the highest concentration seen since July 2020, based on data from Santiment.
These large holders now hold roughly 67.5 percent of the total circulating supply of ADA.
What makes this notable for any Cardano price prediction is that this accumulation kept going even while ADA dropped more than 70% over the last nine months and over 20% so far this year, showing conviction from big wallets despite the extended drawdown.
Cardano Liquidation Overview
As per the CoinGlass Liquidation Data, short positions took slightly more damage in the 1-hour window, but zooming out to 4 hours, 12 hours, and 24 hours, long positions have absorbed most of the pain.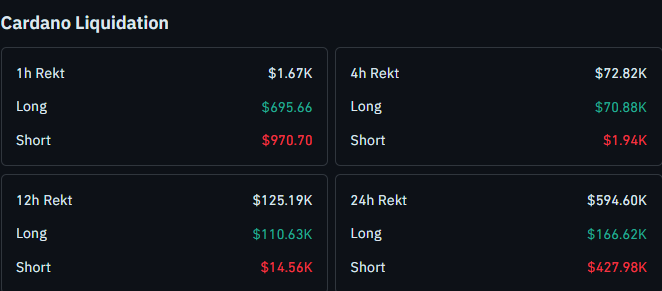
Source: Liquidation data by CoinGlass
This lines up with the sharp bounce ADA has seen after breaking out of the descending channel, since a move like this tends to catch short sellers off guard on the larger timeframes while pushing longs into trouble during the smaller, choppier moves.
Cardano Price Prediction: Chart Analysis
On the 1-hour chart, ADA spent several days getting rejected from a descending trendline, printing lower lows on the second and third taps. 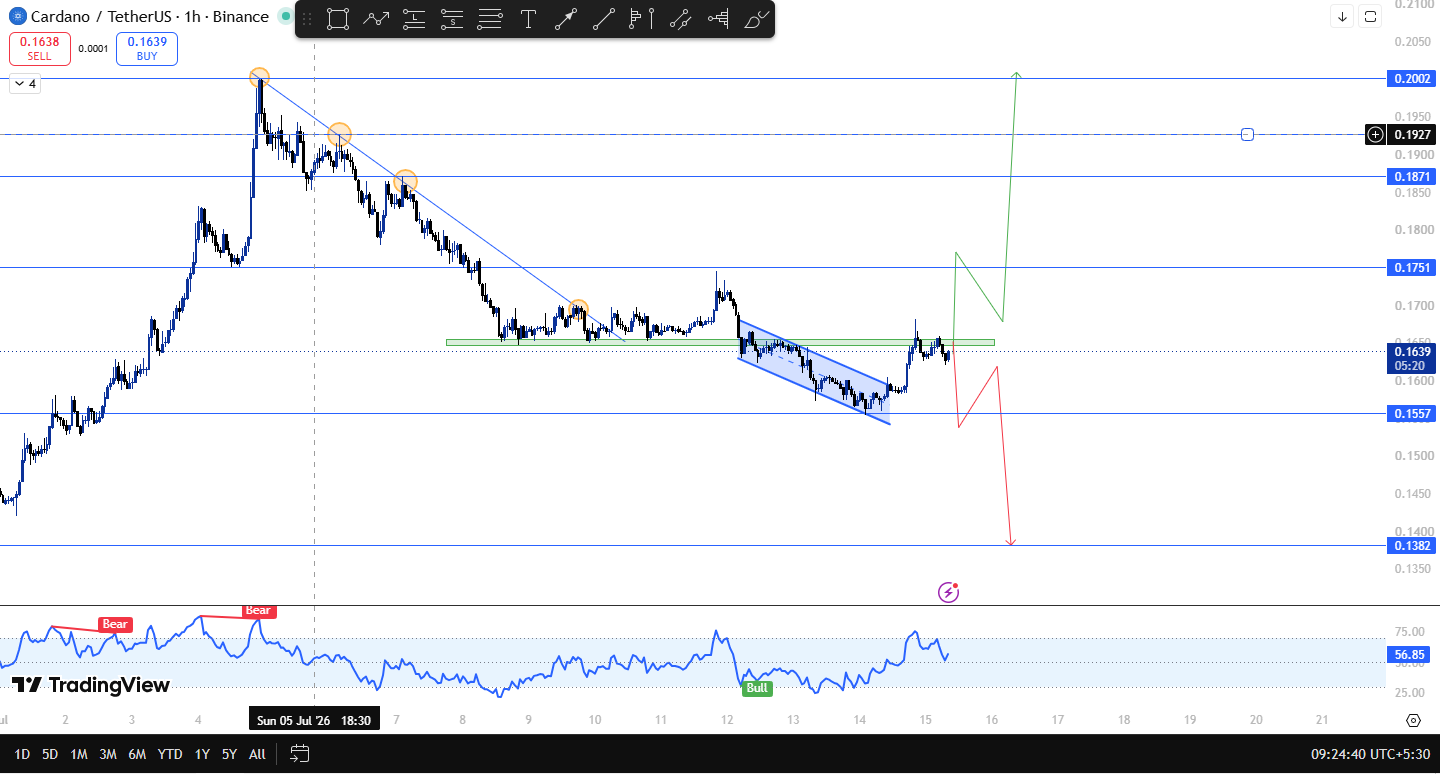
On the fourth tap, price finally failed to make another lower low and instead broke out above the trendline.
After that breakout, $ADA managed to sustain the move for almost a full day before breaking down again, this time slicing through the $0.1655 to $0.1648 zone that had been acting as support.
From there, price slipped into a descending channel and kept grinding lower inside it.
More recently, $ADA broke out of that descending channel and has come back to sustain right around the same $0.1648 to $0.1655 zone, which is now acting as a flip zone after moving from support to resistance.
If the price manages to close above $0.1751, the next resistance sits at $0.1871, followed by $0.1927, and then $0.2002 further up.
On the downside, if ADA gets rejected from this flip zone and breaks the recent low, the next support zone comes in at $0.1557, and below that, $0.1382.
Support and Resistance Levels
Level Type | Price |
Resistance | $0.2002 |
Resistance | $0.1927 |
Resistance | $0.1871 |
Immediate Resistance (Breakout Trigger) | $0.1751 |
Flip Zone / Support | $0.1648 - $0.1655 |
Support | $0.1557 |
Support | $0.1382 |
Risk and Reward: The Honest Version
Factor | Bull Case | Bear Case |
$0.1648-$0.1655 Flip Zone | Holds as support, ADA pushes toward the $0.1751 breakout trigger | Rejects and breaks the recent low, opening the door to $0.1557 and $0.1382 |
$0.1751 Resistance | Clears with strength, opens path to $0.1871, $0.1927, and $0.2002 | Rejects again, price slides back toward the flip zone |
The analysis above combines short-term chart structure with the latest Cardano news and should not be treated as a guarantee of future performance.
Invalidation Level
This entire recovery structure depends on $ADA holding the $0.1648 to $0.1655 flip zone.
A confirmed break and 1-hour candle close below this zone, followed by a break of the recent low, would invalidate the setup and open the path toward $0.1557 and then $0.1382.
Expert View
Traders tracking $ADA on the lower timeframe are watching the $0.1648 to $0.1655 flip zone closely, since this level has already flipped between support and resistance more than once over the past few weeks.
Many see the recent descending channel breakout as an encouraging sign, especially with whale wallets continuing to accumulate ADA even through a steep multi-month decline.
Most agree that a close above $0.1751 would confirm the recovery attempt and open the path toward $0.1871 and $0.1927, while a rejection from the flip zone could send the price back down toward $0.1557 and $0.1382.
Keeping an eye on broader market sentiment remains important for this setup.
Disclaimer: This article is for informational purposes only and should not be considered financial advice. Cryptocurrency markets are highly volatile, and price predictions are not guaranteed. Please do your own research before making any investment decisions.
0
0

 Manage all your crypto, NFT and DeFi from one place
Securely connect the portfolio you’re using to start.


0
0

0
0