Solana Price Prediction – SOL Eyes $105 as The RSI Flashes a Buy Signal

0
0
Highlights:
- Solana price has decreased about 14% to $79, as the crypto market wobbles today.
- The derivatives data show negative sentiment as the OI slides 18%.
- The technical outlook shows a potential rebound as SOL eyes $105, amid RSI reversal.
Solana (SOL) price is in correction, as it slipped 14% to $79 on Friday. The sell-off is also supported by general vulnerability in the crypto market, as Bitcoin (BTC) plunged to a low of $60,000 on Friday. The derivatives data reveal weakness as the Open Interest (OI) of SOL has decreased to the mid-April levels. Technically, SOL eyes a rebound to $105, as the RSI flashes a buy signal.
The price of Solana began the week on the side of the negative trend, continuing its fourth week of losses. SOL has fallen over 43% since mid-January. CoinGlass futures OI of SOL dropped to $5.24 billion on Friday, and that is the lowest level since mid-April 2025. Moreover, it has fallen steadily since a mid-January 2026 high of almost $9 billion. This reduction in OI indicates a declining level of participation by the investors.
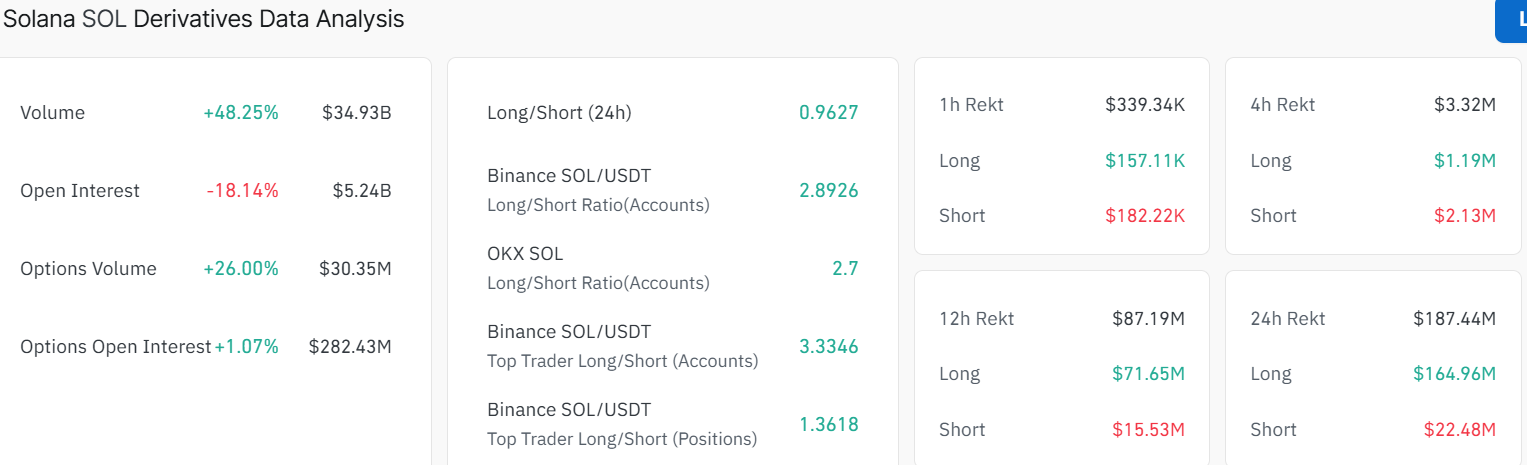
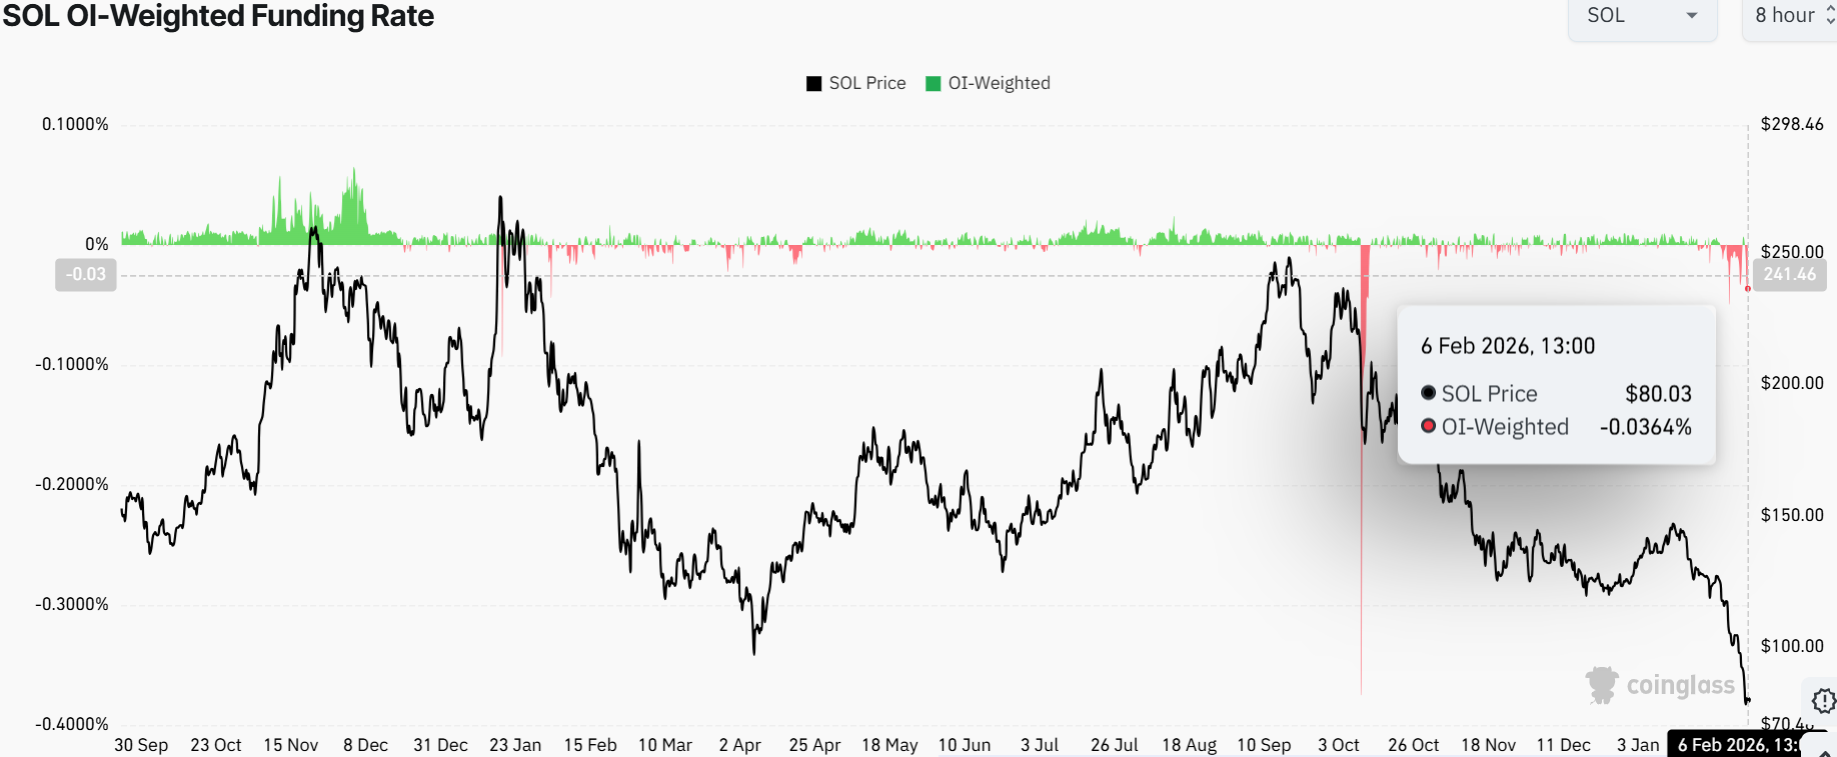
Moreover, CoinGlass SOL’s long-to-short ratio is 0.96 on Friday. Below one, this ratio indicates that the markets are bearish since more traders are placing their bets on the asset price falling. In addition, the bearish perspective is also backed by the data on the funding rate of Solana. The metric has shifted to negative on Friday, at -0.036%, and this is a sign of shorts paying longs and bearishness towards SOL.
SOL Price Targets $105
On the daily chart, Solana is trading below both the 50‑day and 200‑day simple moving averages, which are clustered near $125 and $167, respectively. That setup shows bears still control the short‑term trend. The 50‑day SMA is now acting as an immediate resistance, and the 200‑day SMA is capping any stronger bounce. The recent candles show SOL breaking below the consolidation channel, hitting a low of $67, before rebounding to current levels.
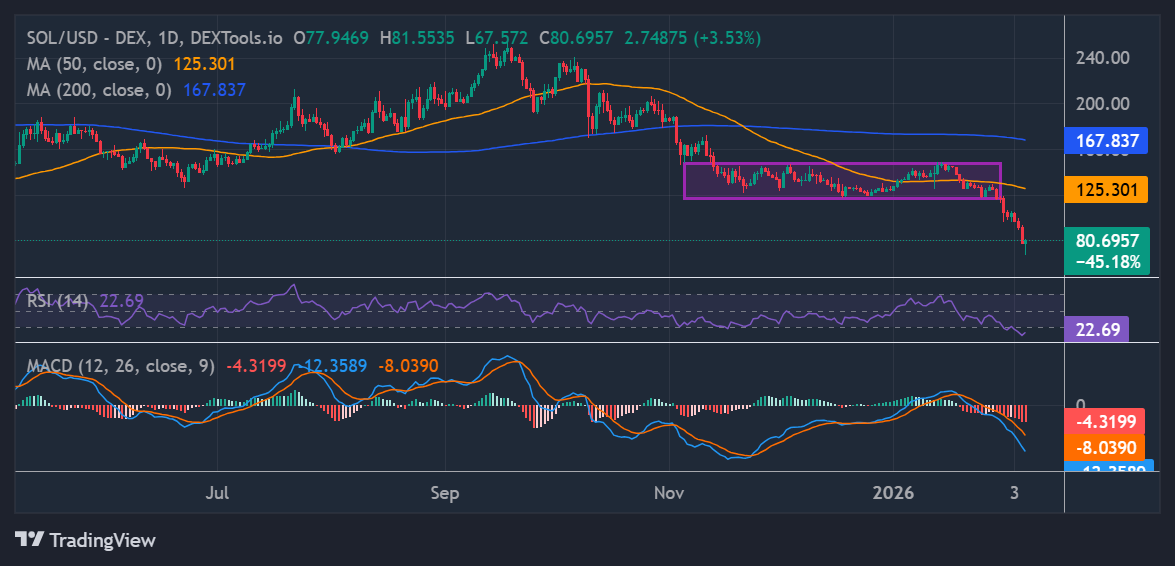
Solana technicals are extremely bearish, painting the market negative. The daily Relative Strength Index sits around 22.69 in the oversold territory. This suggests limited room for aggressive downside as dip buyers return, reinforced by the slight upward reversal trend in the RSI. Meanwhile, the MACD line is below the signal line and in negative territory. However, the histogram bars are red, a sign that bearish momentum is still intact.
Looking ahead, if the SOL price holds above the current levels, a short-term rebound towards the $105 mark could take place. Moreover, if the RSI starts to turn up, a rebound toward the 50‑day SMA around $125 looks possible over the next few weeks. A clean break and daily close above that level would open the door to a move toward $144-$167 resistance zones.
However, if bears continue the downside movement, reinforced by the negative technicals and derivatives market, the altcoin could see a deeper correction towards $60-$50. This could shake out late bulls before a longer‑term recovery.
![]()
eToro Platform
Best Crypto Exchange
- Over 90 top cryptos to trade
- Regulated by top-tier entities
- User-friendly trading app
- 30+ million users
![]()
eToro is a multi-asset investment platform. The value of your investments may go up or down. Your capital is at risk. Don’t invest unless you’re prepared to lose all the money you invest. This is a high-risk investment, and you should not expect to be protected if something goes wrong.
0
0

 Manage all your crypto, NFT and DeFi from one place
Securely connect the portfolio you’re using to start.

0
0


