
$PEPE Whales Load 4.13T Before Big Move: Pepe Price Prediction

0
0

This Pepe price prediction lands at an interesting moment for the frog-themed meme coin. PEPE built its reputation on pure community momentum since its 2023 launch, and that community energy is showing up again in on-chain accumulation data this week.
Today $PEPE trades at $0.00000284, down 0.5% over the past day, with the token consolidating just below recent highs rather than trending hard in either direction.
With a circulating supply of 420.69 trillion tokens matching its total and max supply, PEPE has no future dilution to worry about; its entire supply is already in circulation, which puts the full weight of price action on demand alone.
This article breaks down where $PEPE stands today against that backdrop, not just where the charts point next.
$PEPE Live Market Data
$PEPE is currently trading at
$0.00000284, down 0.5% on the day. The 24-hour range has stayed tight, between $0.00000277 and $0.00000287.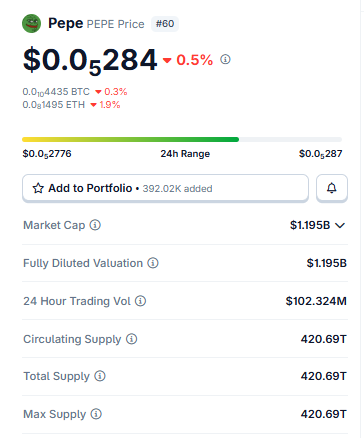
Source: $PEPE market data taken from live exchange feeds, as of Aug 12, 2026. Figures may vary slightly across other tracking websites.
Market cap stands near $1.195B, matching its fully diluted valuation of $1.195B, since all 420.69 trillion tokens are already circulating.
Trading volume over the last 24 hours came in at $102.324M, solid for a meme coin of this size.
Liquidation Data of Pepe
Leverage traders leaned heavily long over the past day, and that positioning has cost them.
Total liquidations
hit $322.91K over 24 hours, with longs taking $183.99K against $138.92K in shorts.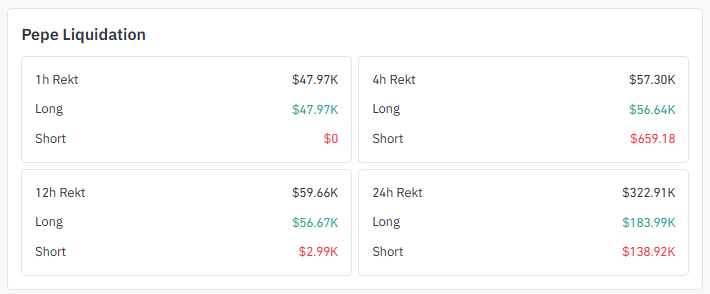
Source: liquidation data taken from Coinglass.
That long-side pressure has been building over shorter windows too. In the last hour alone, longs absorbed the entire $47.97K in liquidations.
The 4-hour and 12-hour windows show a similar lopsided pattern, with the long ones taking the overwhelming share of the pain each time.
This kind of one-sided liquidation flow usually points to over-leveraged long positions getting flushed out during minor pullbacks, rather than a broad reversal in trend.
Exchange Volume of $PEPE
MEXC leads Pepe trading volume right now at $117.79M, followed by OKX at $53.96M and LBank at $19.51M.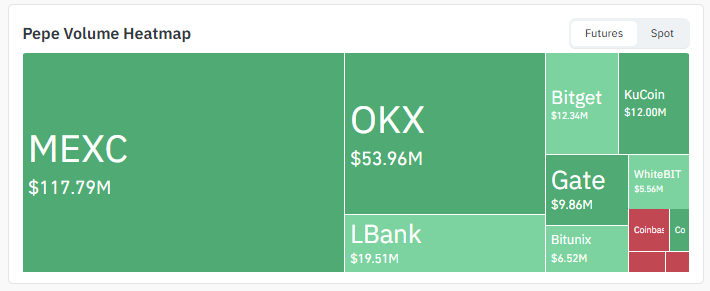
Source: Volume heatmap data taken from Coinglass.
Bitget adds $12.34M, and KuCoin contributes $12.00M, while Gate, Bitunix, WhiteBIT, and Coinbase round out smaller but steady volume across the board.
Spread across this many venues, liquidity looks sufficient to support a breakout move in either direction without major slippage.
Pepe News Today
On-chain trackers flagged a notable whale accumulation signal this week: large holders added more than 4,130,000,000,000 $PEPE coins in just seven days, a sizable increase even accounting for PEPE's oversized token count.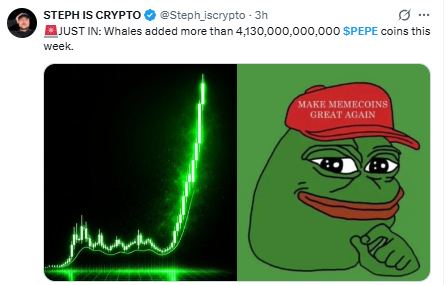
Source: Data Taken From @Steph_iscrypto, X Account.
That kind of accumulation from bigger wallets often reflects growing confidence heading into a potential move, though it doesn't by itself confirm which direction price will break.
Community sentiment around the coin has also picked up alongside the accumulation data, with meme coin enthusiasm resurfacing as $PEPE holds up.
Near recent highs, the kind of narrative tailwind that can support a bullish Pepe price prediction if the chart levels below cooperate.
Key Takeaways
-
PEPE is trading around $0.00000284, down 0.5% in the last 24 hours.
-
On the 4H chart, price is compressing inside a symmetrical triangle, with a breakout above $0.000003104 opening the door higher.
-
The daily chart shows price inside an ascending channel, with a break above $0.000003118 Levelsing $0.000003458.
-
Longs have taken the overwhelming share of liquidations across every timeframe, a sign of one-sided leverage building up.
-
Whales added over 4.13 trillion $PEPE tokens this week, a notable accumulation signal from larger holders.
Technical Analysis of $PEPE
4-Hour Chart Analysis for Pepe Price Prediction
The 4H chart has $PEPE compressing inside a symmetrical triangle, with lower highs and higher lows converging toward a decision point.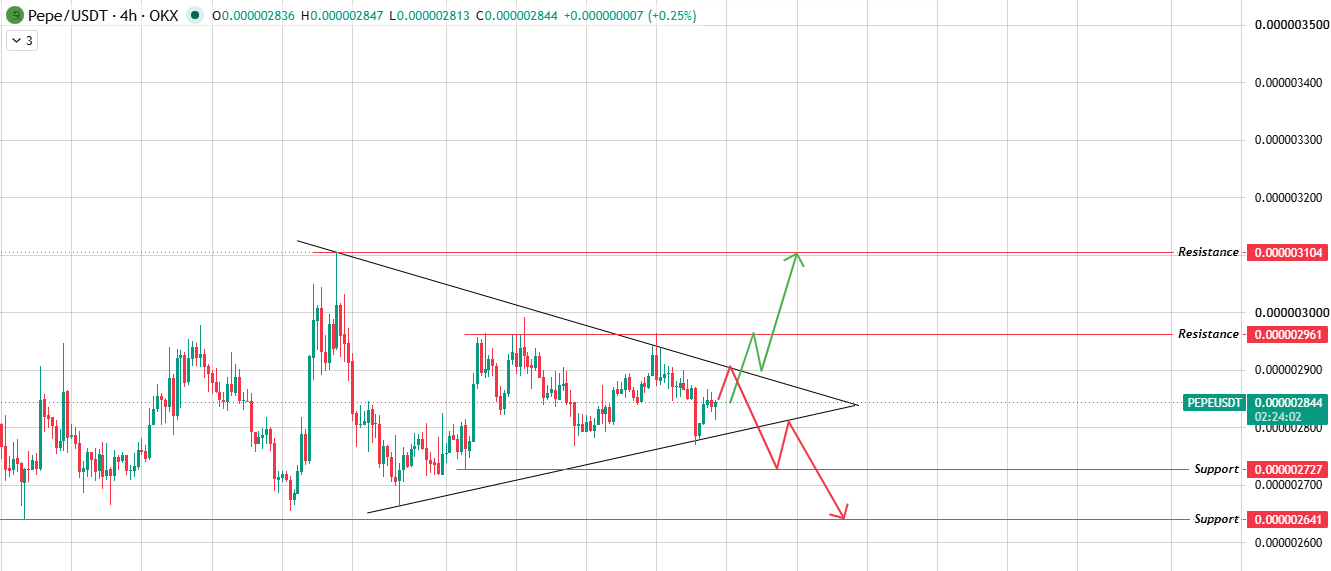
Source: Chart taken from TradingView.
If the price breaks above the upper boundary of the triangle with volume, the next stop is resistance at $0.000002961, then $0.000003104.
If instead the price breaks down through the lower boundary of the triangle, expect a slide toward support at $0.000002727 and then $0.000002641.
Daily Chart Analysis for Pepe Price Prediction
On the daily chart, $PEPE is trading inside an ascending channel that has guided the recovery from recent lows.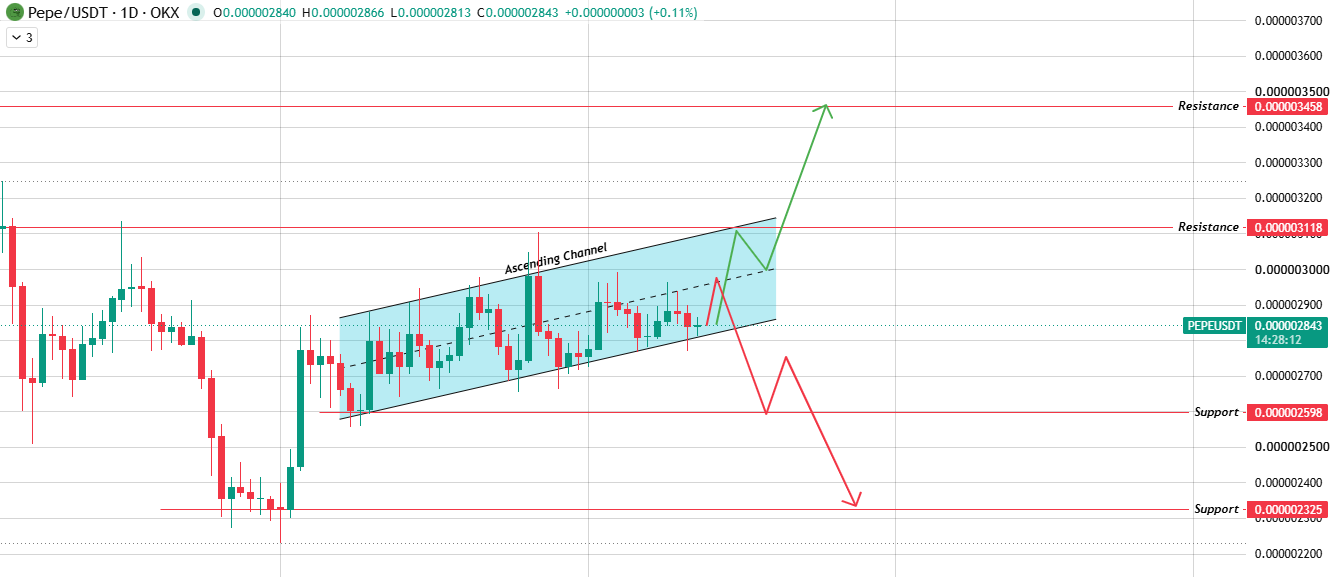
Source: Chart taken from TradingView.
A break above the upper boundary of the channel clears resistance at $0.000003118 first, then $0.000003458.
If the price instead gets rejected from the upper boundary and breaks down through the lower boundary of the channel, support sits at $0.000002598, with $0.000002325 as the next level below that.
Both timeframes point to the same conclusion: $PEPE is coiled tightly, and the next volume-backed breakout will likely decide the trend for weeks to come.
Bull / Base / Bear Case
|
Scenario |
Trigger |
Levels |
|
Bull |
Break above $0.000002961 (4H) or $0.000003118 (1D channel top) with volume |
$0.000003104 – $0.000003458 |
|
Base |
Price holds between $0.000002727 and $0.000002961. |
Sideways chop |
|
Bear |
Break below $0.000002641 (4H) or $0.000002598 (1D channel bottom). |
$0.000002325 – $0.000002641 |
Glossary
Symmetrical Triangle: Two converging trendlines squeeze price into a narrowing range, usually right before a sharp move.
Ascending Channel: Price moves higher here, bouncing between two upward-sloping trendlines until it breaks one side.
Whale Accumulation: When large wallet holders increase their token holdings over a short period, it is often watched as a sentiment indicator.
Liquidation: This happens when an exchange forcibly closes a leveraged position because the trader ran out of margin.
Support Zone: Think of it as a price floor where buying pressure has historically stepped in.
Resistance Level: The opposite of support, a ceiling where selling pressure tends to cap upward moves.
Methodology
Levels used in this Pepe price prediction come directly from chart data on the 4H and 1D timeframes.
Liquidation and volume figures are sourced from Coinglass. No price levels are extrapolated beyond what appears on the charts.
Disclaimer: This article is for informational purposes only and should not be treated as financial advice. Cryptocurrency markets are highly volatile, and prices can change quickly. Always do your own research and consult a financial advisor before making investment decisions.
0
0


 Manage all your crypto, NFT and DeFi from one place
Securely connect the portfolio you’re using to start.

0
0

0
0

0
0

0
0