Daily Market Review: BTC, ETH, AR, ICP, FET
13d ago•

bullish:
0
bearish:
0
Share

Bulls still dominate today’s session, as evidenced by the increase in the global market cap. The total cap stood at $2.34 as of press time, representing a 1.98% increase over the last 24 hours. The trading volume also jumped by 23% to stand at $11B as of press time.
Bitcoin Price Review
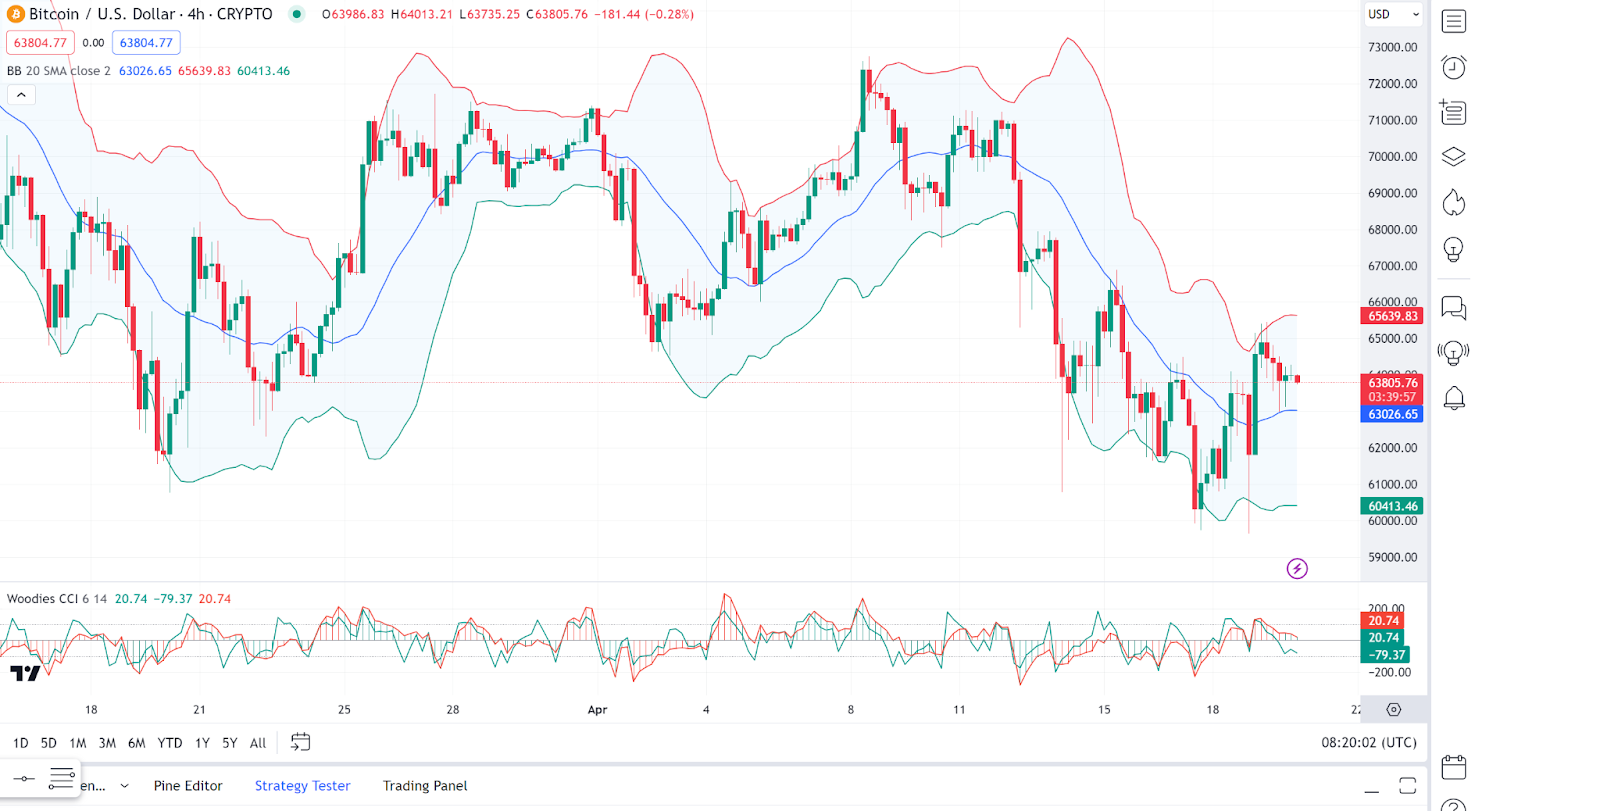
Bitcoin (BTC) has now fallen below $64K as the crypto king enters a consolidation period. The chart depicts a Bollinger Bands indicator, where the price action is currently in the lower half of the bands, suggesting bearish momentum. There has been a recent sharp fall below the 20-period Simple Moving Average (SMA), indicating intense selling pressure.
On the other hand, the Woodies CCI shows a dip below the zero line, which typically signifies bearish sentiment. As of press time, the Bitcoin price stood at $62,913, representing a 0.8% decrease from its previous 24-hour price.
Ethereum Price Review
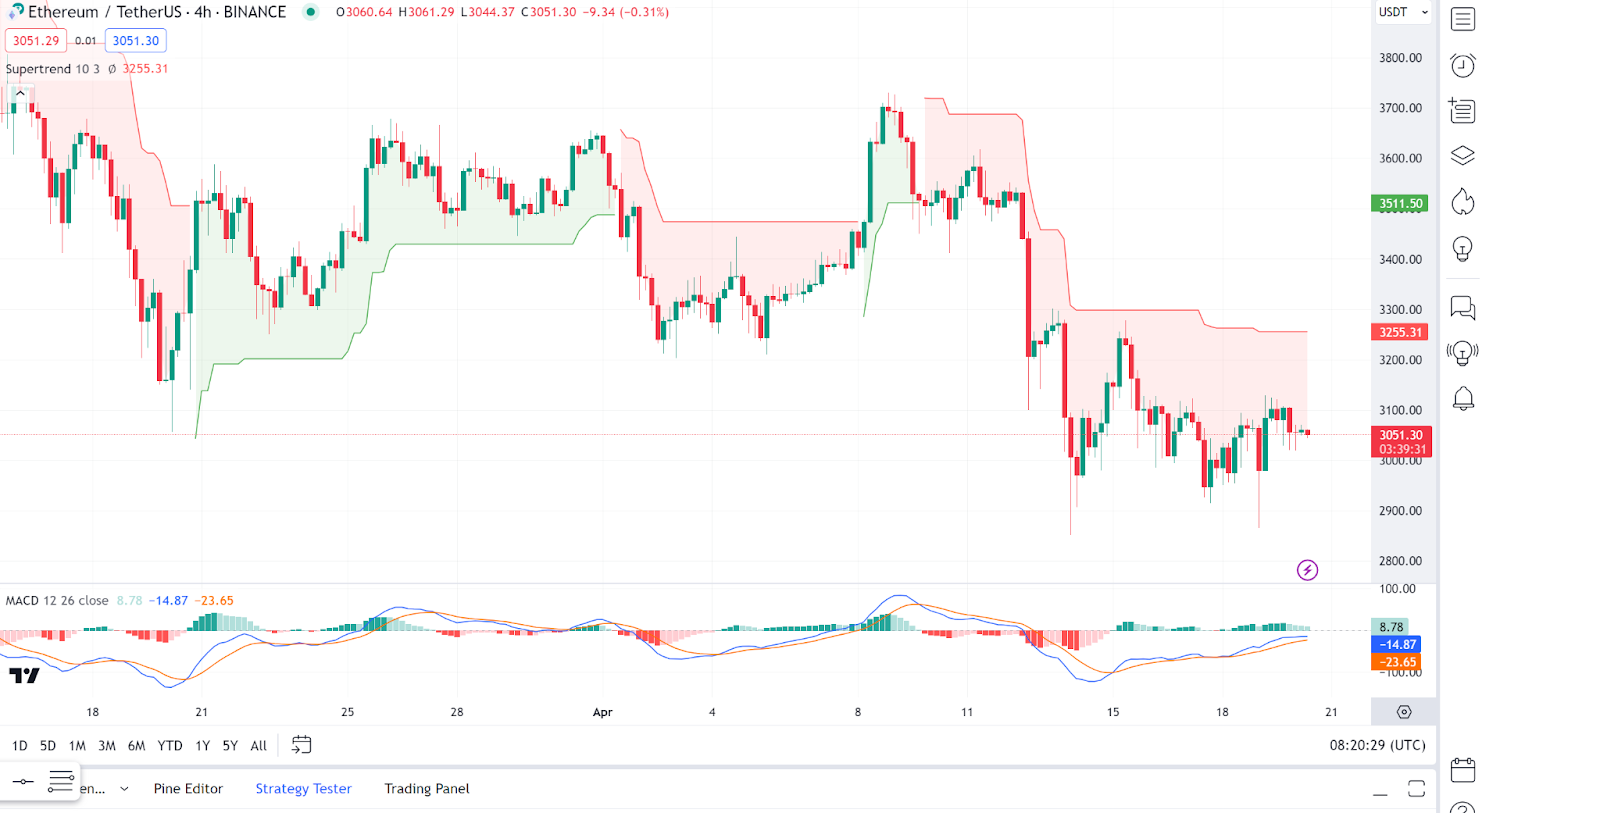
Ethereum (ETH) has also entered a consolidation phase once again, failing to post gains in today’s session. In-depth analysis shows that the Ethereum price oscillates near the SuperTrend line, indicating uncertainty or potential consolidation.
On the other hand, the MACD histogram is above zero but shows a reduction in bullish momentum as the histogram bars get shorter. As of press time, the Ethereum price stood at $3,054, representing a 0.96% decrease from its previous 24-hour price.
Arweave Price Review
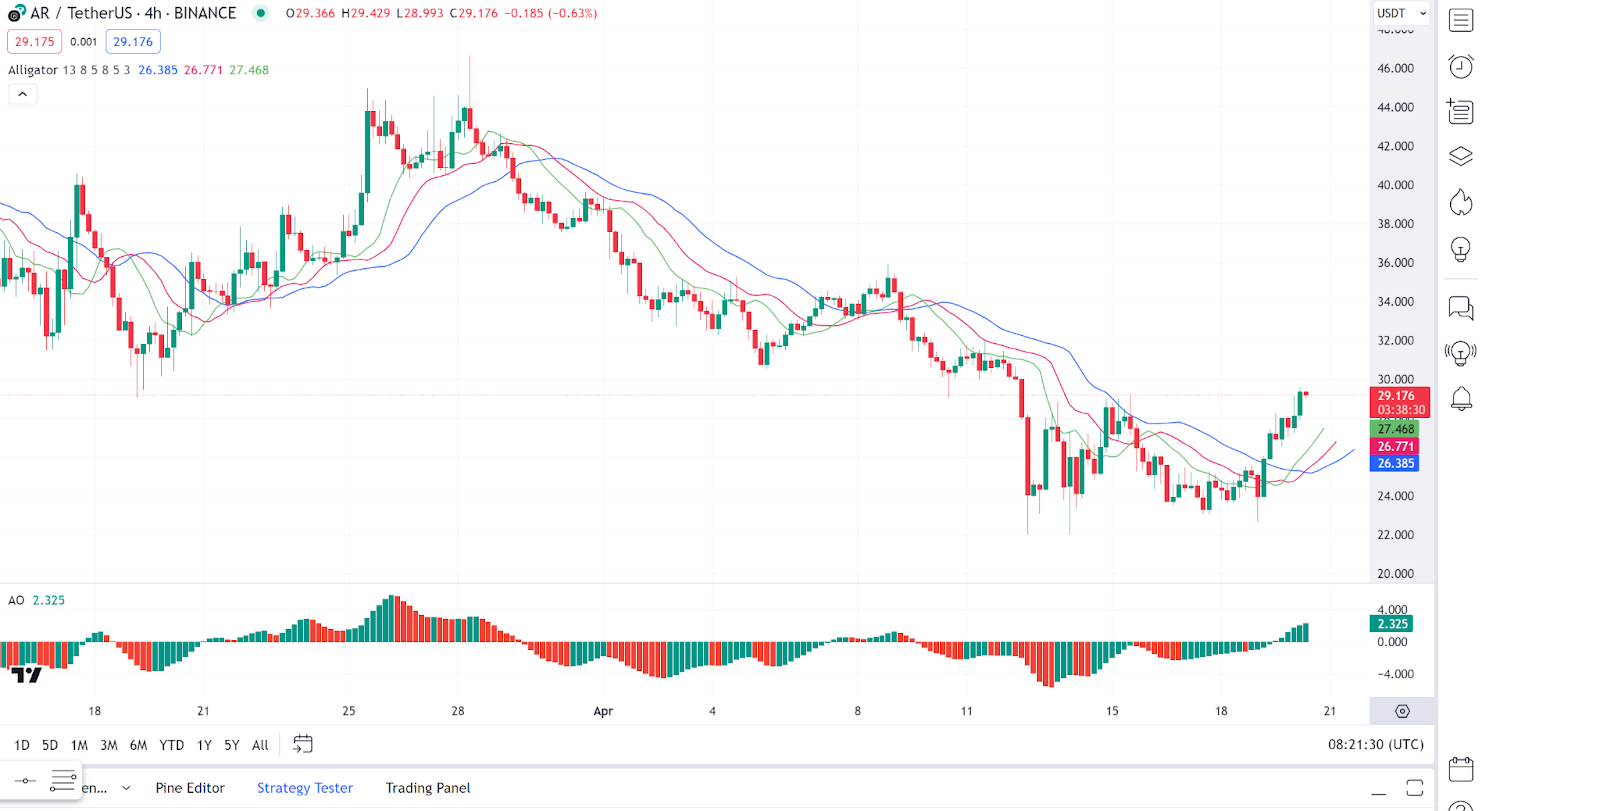
Arweave (AR) is today’s top gainer as the altcoin posted some remarkable gains today. Analysing Arweave price charts, we notice that there was a recent crossover of the green line (lips) below the red (teeth) and blue (jaw) lines on the Williams Alligator, which may suggest a potential change in trend or a slowdown in the bullish momentum.
On the flip side, the Awesome Oscillator (AO) has crossed above the zero line, indicating an increase in bullish momentum. As of press time, the Arweave price stood at $29.11, representing a 12.15% increase from its previous 24-hour price.
Internet Computer Price Review
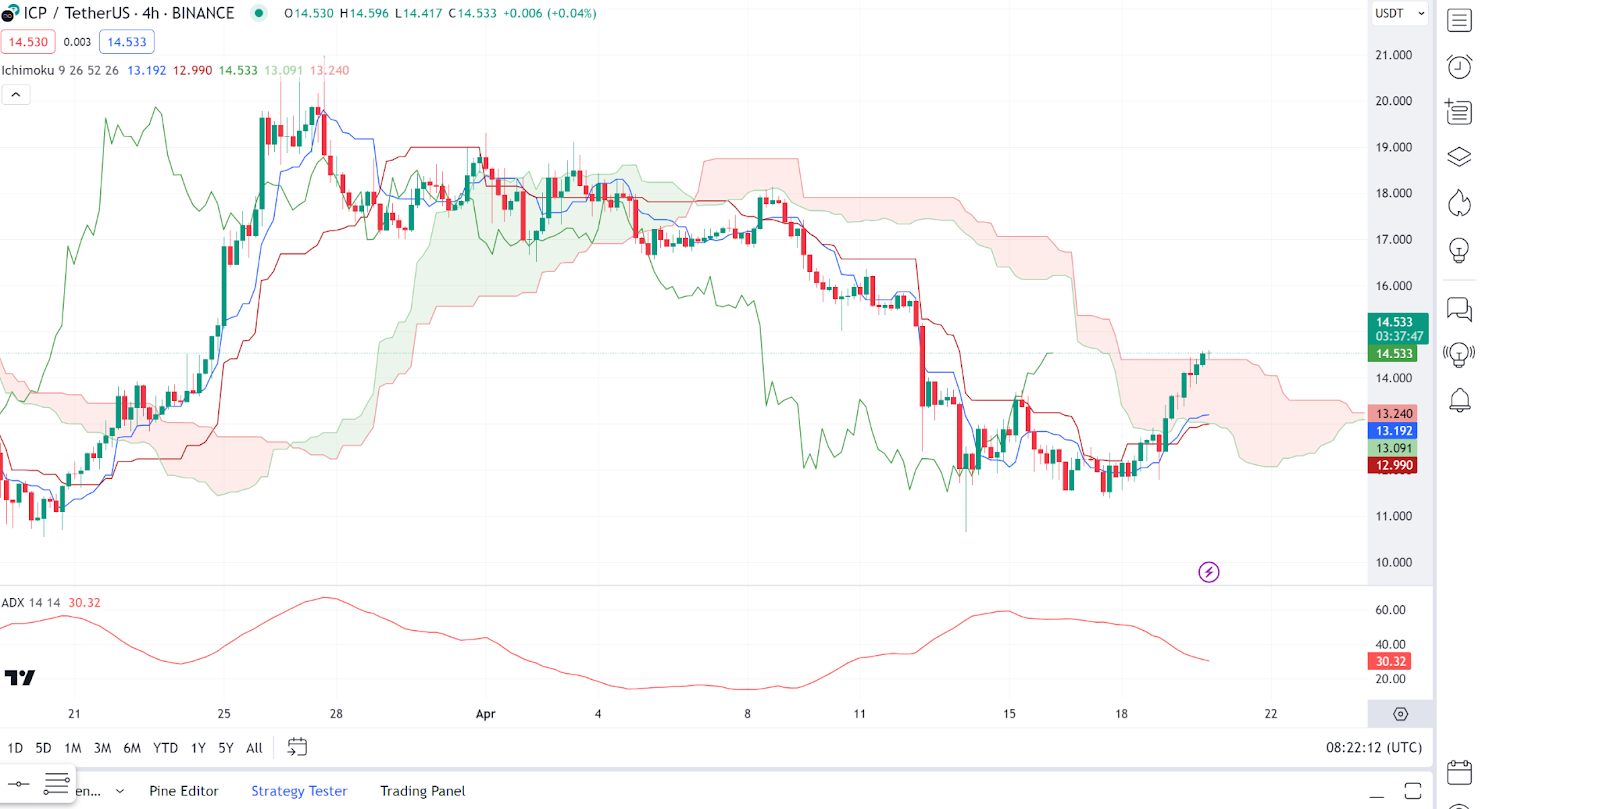
In today’s session, Internet Computer (ICP) was another gainer, posting some notable gains. Looking at an in-depth analysis, we notice the Ichimoku Cloud with the price recently breaking above the cloud, suggesting a potential change to a bullish trend. The Tenkan-Sen and Kijun-Sen lines are close to each other, which might indicate consolidation or indecision.
On the other hand, the Average Directional Index (ADX), an indicator for gauging trends, is currently at 30 indicating a strong bullish trend. As of press time, the Internet Computer price stood at $14.67, representing an 11.2% increase from its previous 24-hour price.
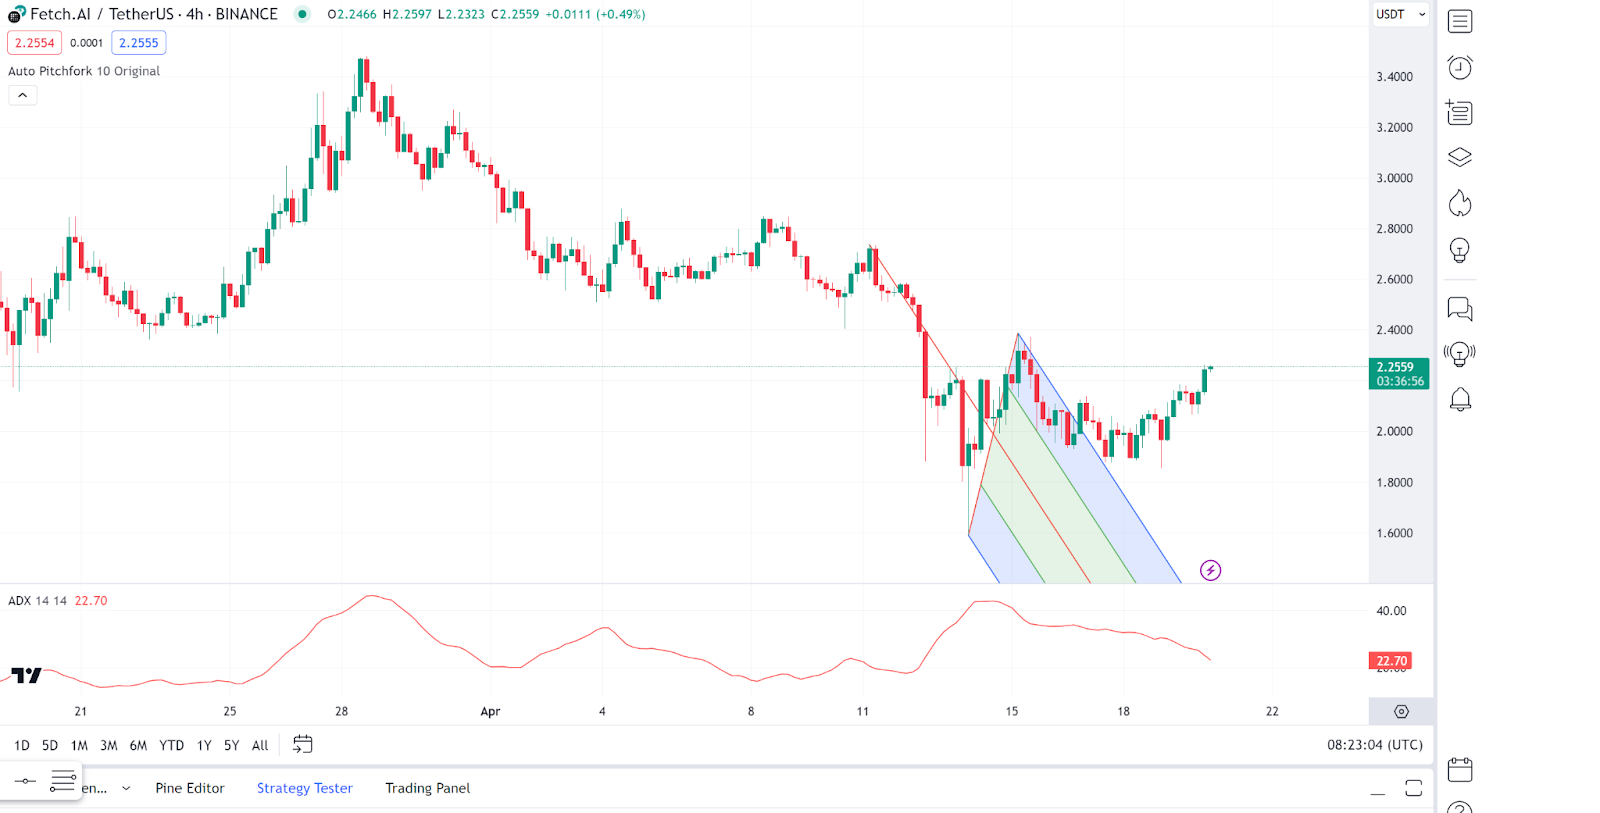
Fetch.ai Price Review
Fetch.ai (FET) is the other top gainer in today’s session as it also managed some notable gains. Looking at an in-depth analysis, we see that the Fetch.ai price action is currently on an upward trajectory, breaking above the middle line of the pitchfork, which can be seen as a bullish signal.
On the other hand, the ADX line is trending upwards but still below the 25 threshold, which means that the trend strength is not yet considered vital. As of press time, the Fetch.ai price stood at $2.28, representing an 9.3% increase from its previous 24-hour price.
13d ago•
bullish:
0
bearish:
0
Share
 Manage all your crypto, NFT and DeFi from one place
Securely connect the portfolio you’re using to start.

bullish:
0
bearish:
0

bullish:
0
bearish:
0

bullish:
0
bearish:
0

bullish:
0
bearish:
0