
Bonk Price Prediction 2026-2050: Will BONK Surprise With 120X?

0
0
$Bonk (BONK) helped kick off Solana's meme coin era back in December 2022, and it's still one of the most recognized names tied to that ecosystem.
Since its early rally, it's fallen more than 90% from its peak and now sits tightly coiled just above its cycle low.
This Bonk price prediction 2026–2050 works directly off the monthly chart's Fibonacci structure, so every target here traces back to something visible on the chart itself, not just optimism.
BONK Current Price Level
BONK is trading around $0.00000408, sitting essentially right on top of the 0 Fibonacci swing low at $0.00000406, just above Support 1 at $0.00000390 and not far above the deeper floor at $0.00000264.
The chart tells a familiar story: BONK launched from near that swing low, rallied hard, and has since spent a long stretch grinding back down close to where it started.
The current price sits barely above the absolute bottom of this range, while the token's prior cycle high sits far above where it trades today, the exact gap this forecast has to work through.
Monthly Chart and Fibonacci Structure
The monthly chart lays out BONK's cycle: a swing low around $0.00000406 and a Fibonacci ladder mapped up toward the token's prior highs from there.
Price has recently compressed into a tight range hugging that swing low, exactly the kind of coiling that often precedes a bigger move once it resolves.
A descending trendline connects the earlier highs down through the recent lows, and $BONK hasn't cleared it yet.
Until a confirmed monthly close breaks and holds above that line, this remains a basing pattern rather than a confirmed reversal, though the fact that price has stopped carving fresh lows is worth watching. 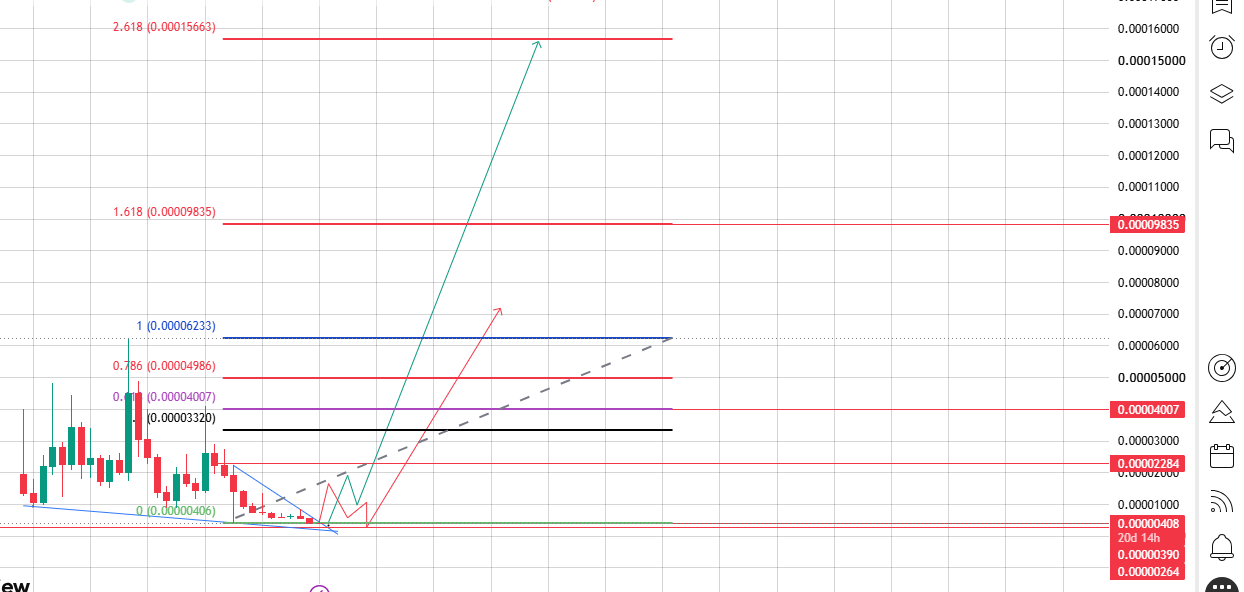
Source: Chart Taken From TradingView
| Fibonacci Level | Price Target | Significance |
|---|---|---|
| Resistance 1 | $0.00002284 | First real test above the base, ~5.6x current price |
| 0.5 Fib | $0.00003320 | Psychological halfway point |
| 0.618 Fib | $0.00004007 | Would confirm a genuine trend reversal |
| 0.786 Fib | $0.00004986 | Strong resistance just under the prior high |
| 1.0 Fib / Prior High | $0.00006233 | Full retracement back to BONK's cycle high |
| 1.618 Extension | $0.00009835 | First major long-term bullish target |
| 2.618 Extension | $0.00015663 | Deep multi-cycle extension target |
Bonk Price Prediction 2026–2030
Short-term, everything depends on whether BONK can clear the descending trendline and start reclaiming lost ground. If that break holds through 2026, Resistance 1 at $0.00002284 becomes the first realistic target, more than a 5x move from here.
Carrying momentum into 2027–2028, a push through the 0.5 Fib and into the 0.618 Fib at $0.00004007 becomes realistic if Solana's ecosystem keeps expanding and broader meme coin sentiment stays supportive.
By 2030, if BONK clears the 0.786 Fib and reclaims the full 1.0 Fib at $0.00006233, that's a complete round trip back to its prior all-time-high territory, the biggest psychological milestone in this outlook.
That's roughly a 15x move from today, and it would take the kind of sustained demand only a genuine meme coin season delivers.
Bonk Price Prediction 2035–2040
Beyond 2030, the question shifts to whether $BONK can hold its spot as Solana's flagship meme coin across multiple cycles, fending off newer entrants while its built-in burn mechanics keep chipping away at its 88.87 trillion token supply.
If $BONK clears the 1.0 Fib zone and pushes into the 1.618 extension near $0.00009835, that would be one of the largest multi-year recoveries a Solana-native token has produced from a drawdown this deep, likely in sharp waves rather than a straight line, given $BONK's volatility history.
By 2040, assuming continued burns and sustained relevance, a range between the 1.618 and 2.618 extensions, roughly $0.0000984 to $0.000157, becomes a realistic zone.
Bonk Price Prediction 2050
A 2050 figure is a long-range scenario exercise, not a precise forecast. Nearly 25 years out is well beyond what any chart can reliably project.
Bearish scenario: $BONK loses relevance as newer Solana meme tokens take attention, the trendline never gets reclaimed in a lasting way, and the price settles into the $0.0000015–$0.000003 range.
Base scenario: $BONK holds its position as one of crypto's most recognized meme coins, burns keep chipping away at its fixed 88.87 trillion supply, and price oscillates around the 1.618–2.618 Fib zone, landing between $0.0001 and $0.00016, arguably the most defensible outcome at this distance.
Bullish scenario: $BONK becomes the rare meme coin that compounds relevance across decades, staying Solana's flagship community token the way Dogecoin remains crypto's original meme asset.
In this extreme case, with meaningful multi-decade burns and demand far beyond anything seen to date, BONK could stretch toward $0.0004 by 2050.
Against its fixed 88.87 trillion supply, that implies a market cap near $35.5 billion large but within range of what a genuinely dominant, decades-old crypto asset could command. Treat this as a long-shot ceiling, not an expectation.
Bonk (BONK) Price Prediction Target Table
| Year | Bear Case | Base Case | Bull Case |
|---|---|---|---|
| 2026 | $0.0000015 | $0.00000408 | $0.00002284 |
| 2030 | $0.0000020 | $0.00004007 | $0.00006233 |
| 2040 | $0.0000015 | $0.00007000 | $0.00009835 |
| 2050 | $0.0000010 | $0.00013000 | $0.00040000 |
Treat the upper end of this range, especially the 2050 bull case, as a long-shot scenario rather than an expectation. These figures are anchored to the chart's own levels and BONK's fixed supply, not guarantees.
Factors That Could Shape This Forecast
Trendline confirmation matters first. $BONK is still working to clear the descending trendline; a confirmed monthly close above it would be the first real signal the downtrend is ending.
Ongoing supply burns continue trimming $BONK's fixed 88.87 trillion supply, directly supporting the higher end of this range.
Solana's own growth drags $BONK along with it more than almost anything else, since a thriving Solana ecosystem tends to mean more attention and liquidity flowing toward its flagship meme coin.
Broader crypto cycles will still set the tone, since Bitcoin and Ethereum phases largely determine how much capital rotates into meme coins during any given stretch.
Community persistence and first-mover status matter here too. BONK's fair-launch airdrop built a genuinely large early holder base, and that community has stuck around longer than most tokens that launched around the same time.
Final Thoughts
BONK's chart tells the story of a coin that rallied hard early on and has since spent a long stretch grinding back down close to where it started, now coiling in a tight base right at its swing low.
Whether the next chapter is a genuine recovery or another failed attempt comes down to whether that descending trendline finally gets cleared and held.
Stretching that logic to 2050 means accepting a wide band of outcomes rather than one confident number. Treat this Bonk price prediction 2026–2050 as a research starting point, not financial advice.
Meme coin markets move on community energy and ecosystem growth as much as chart structure, and two and a half decades is a long time for either to shift.
Disclaimer: This article is for informational purposes only and should not be considered financial advice. Cryptocurrency investments, especially in high-volatility meme coins like BONK, carry significant risk of loss. Always do your own research before investing.
0
0


 Manage all your crypto, NFT and DeFi from one place
Securely connect the portfolio you’re using to start.

0
0

0
0

0
0

0
0