
Solana Price Eyes $100 Target as Bulls Fight to Crack Key $80 Wall

0
0
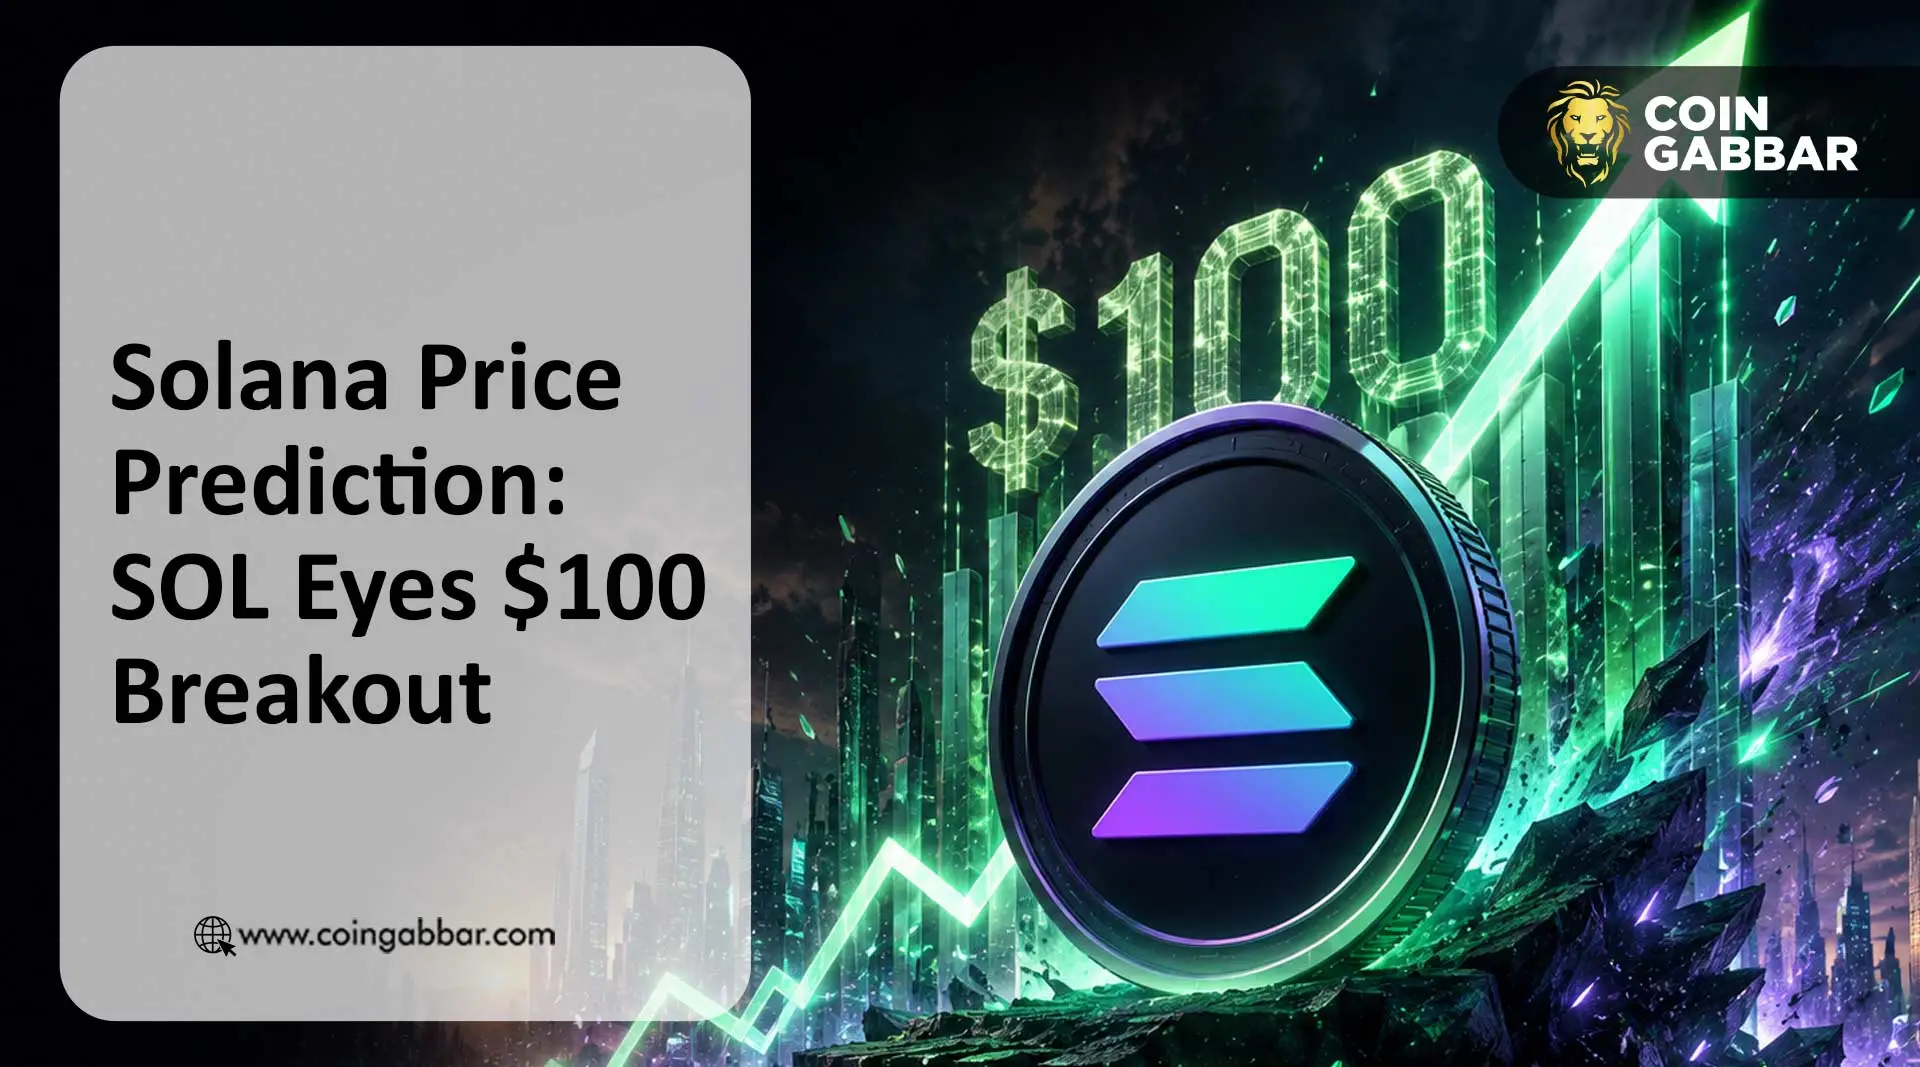
Solana is trading near $76 today, sitting right below a wall of resistance that traders have been watching for days. The Solana price prediction for this week hinges on one thing: whether SOL can close above $78 to $80 and hold there.
Right now, SOL is stuck in a tight range. Buyers have tried to push higher, but sellers keep showing up near $78.50. That level lines up with the 100-day EMA, which makes it a tougher wall to break.
What is the Solana price doing right now?
SOL is changing hands around $76 to $77, up slightly over the past day. The coin has been consolidating for weeks inside what chart watchers call a parallel channel.
The mid-range of that channel sits close to $78. A clean break above it, on strong volume, is the first thing bulls need to see.
Why is $78 to $80 such a big deal for SOL?
This zone is not random. It stacks up with three separate signals at once.
First, it is the resistance trendline from the parallel channel pattern. Second, it matches the 100 EMA on the daily chart. Third, it is close to where a descending triangle breakout is being tested.
When multiple signals point to the same price, traders tend to watch it closely. A daily close above $80 would be the strongest confirmation.
What does the Tom DeMark Sequential indicator show?
As per crypto analyst Ali, the Tom DeMark Sequential tool has flashed a buy signal on Solana's daily chart. This kind of signal often leads to a short bounce lasting one to four candles.
Sometimes it marks the start of a longer bullish countdown instead. Either way, it adds to the case that downside momentum may be fading for now.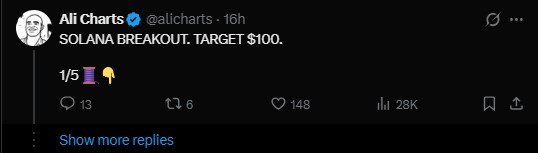
Is the MACD bullish for Solana?
Yes, the MACD has printed a golden cross on the daily timeframe. This happens when a short-term moving average crosses above a longer-term one, and it is often read as an early bullish signal.
It does not guarantee a rally on its own. But paired with the DeMark buy signal, it adds weight to the bullish case.
What does RSI say about Solana momentum?
The Relative Strength Index (RSI) is sitting near 57. That is above the neutral 50 mark, showing mild bullish momentum.
It is still far from the overbought zone above 70. This means SOL has room to run higher before momentum indicators flash a warning.
Solana price targets if SOL breaks above $80
Scenario | Trigger | Price Target |
Short-term bounce | Break above $78.70 | $84 – $88 |
Extended rally | Sustained move above $80 | $92 – $96 |
Bull case | Break of channel upper boundary | Toward $100 |
Rejection at resistance | Fails to close above $78.50 | Range stays $74 – $78 |
Bearish breakdown | Daily close below $74 – $75 | $70, then $64 – $60 |
These are technical zones based on chart patterns, not guaranteed outcomes. Crypto markets can move fast in either direction.
What happens if Solana fails to break resistance?
A failed breakout is a real possibility here. $SOL has been rejected at similar levels before during this consolidation phase.
If price slips below $74 to $75, the bullish structure gets weaker. That could open the door to a drop toward $70, and possibly the $64 to $60 zone if selling pressure builds.
Solana price prediction: the bigger picture
The setup right now leans slightly bullish, but it is not a done deal. SOL needs a decisive daily close above $80 to really shift momentum in favor of buyers.
Until that happens, SOL remains a range-bound asset stuck between $74 and $78. Traders watching the Solana chart will likely wait for confirmation before adding new positions.
The $100 target tied to the channel's upper boundary is a longer-term possibility, not something guaranteed by any single signal. It would likely require several weeks of sustained buying pressure and a broader crypto market that stays supportive.
For now, the next few daily candles around the $78 to $80 zone should tell traders a lot about where SOL heads next.
Disclaimer
This article is for informational purposes only and does not constitute financial, investment, or trading advice. Past performance and technical patterns do not guarantee future results. Always do your own research and consult a licensed financial advisor before making any investment decisions.
0
0

 Manage all your crypto, NFT and DeFi from one place
Securely connect the portfolio you’re using to start.

0
0

0
0

0
0

0
0