Polkadot price prediction 2025-2031: A bullish pattern?

0
0

Key takeaways:
- In 2025, Polkadot might reach a maximum price value of $6.87 and an average value of $6.03
- In 2028, the DOT price can reach a maximum price of $21.09 with an average of $18.31.
- The price of Polkadot is predicted to reach a maximum value of $60.30 in 2031.
Polkadot (DOT) has shown impressive growth and resilience in a volatile cryptocurrency market, supported by its strong multichain protocol architecture and investor confidence. A major contributor to this success is the Sinai Upgrade on its Acala Network, enhancing functionality and security.
With over 32 million transactions validated in October 2024 by the Polkadot Relay Chain, the network demonstrates significant activity and utility. A notable increase in unique wallets further signals growing user adoption and engagement, strengthening Polkadot’s position as a leading blockchain platform.
Will DOT reach new heights soon? Let’s get into the Polkadot price prediction for 2025-2031.
Overview
| Cryptocurrency | Polkadot |
| Token | DOT |
| Price | $7.16 |
| Market Cap | $11.07B |
| Trading Volume | $339.47M |
| Circulating Supply | 1.53B DOT |
| All-time High | $55.00 Nov 4, 2021 |
| All-time Low | $2.69 Aug 19, 2020 |
| 24-hour High | $6.73 |
| 24-hour Low | $7.34 |
Polkadot price prediction: Technical analysis
| Price Prediction | $10.46 (43.77%) |
| Volatility | 16.07% |
| 50-Day SMA | $7.74 |
| 14-Day RSI | 45.57 |
| Sentiment | Bearish |
| Fear & Greed Index | 70 (Greed) |
| Green Days | 11/30 (37%) |
| 200-Day SMA | $5.71 |
Polkadot price analysis: DOT teases rally amid bullish momentum
- Polkadot price analysis shows an uptrend, highlighting moderate investor activity.
- DOT saw a steady climb from $7.62 to $7.76 within the past day.
- DOT is trading above its short-term moving averages, signaling continued bullish momentum.
Polkadot price analysis on January 6th, 2025, shows (DOT) trading at $7.76, reflecting a 1.27% gain in the past 24 hours. The cryptocurrency’s trading volume stands at $269.62M, highlighting moderate investor activity. With a market cap of $11.92B, DOT maintains its position as the #17 cryptocurrency by market ranking. The current bullish sentiment in the market is providing strong tailwinds for DOT’s upward trajectory.
Polkadot daily chart analysis: DOT shows a steady recovery
Polkadot daily chart analysis shows (DOT) is trading above $7.70, continuing its recovery after forming strong support around the $7.50 level. The price movement indicates a bullish trend, with higher lows and highs observed in recent sessions. The next significant resistance lies at $7.80, which, if broken, could lead to a rally toward the $8.00 psychological barrier. The upward momentum reflects increased buying pressure as the broader cryptocurrency market maintains a positive sentiment.
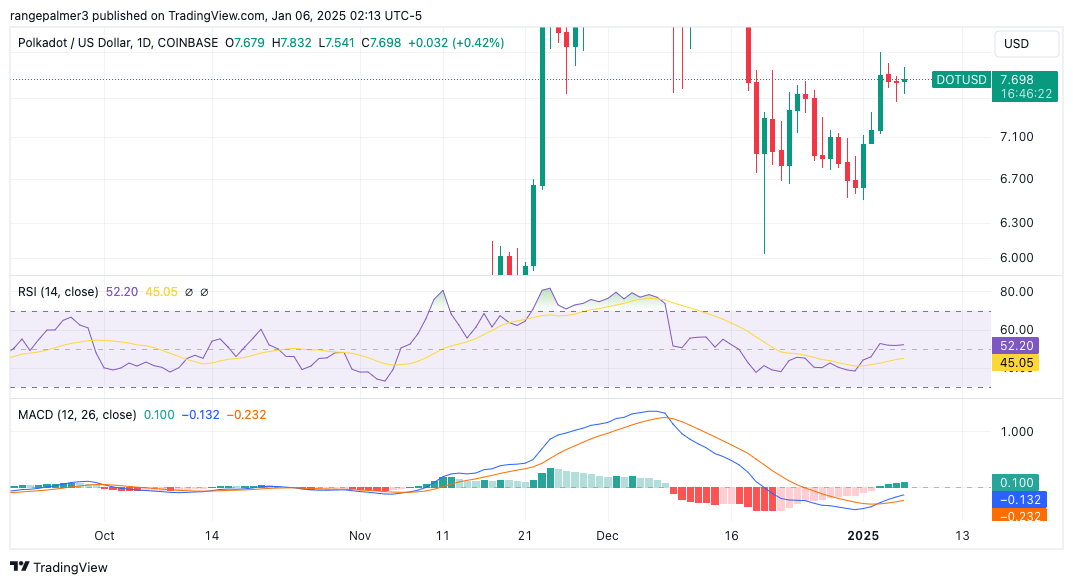
The Relative Strength Index (RSI) is at 52.80, signaling neutral conditions but showing an upward trajectory above its signal line. This indicates increasing bullish momentum without entering overbought territory, leaving room for further price gains. Additionally, the MACD (Moving Average Convergence Divergence) has shown a bullish crossover, with the MACD line crossing above the signal line. The growing green histogram bars reinforce the bullish outlook, suggesting further upward movement is likely.
With support levels established at $7.60 and $7.50, DOT is positioned well to sustain its recovery. However, a break above the $7.80 resistance is crucial to confirm the continuation of this bullish trend. Traders should closely monitor trading volume and MACD signals to gauge the strength of the momentum. Failure to break resistance could lead to consolidation or a pullback toward support zones. For now, DOT shows a promising path to further gains.
Polkadot 4-hour analysis: DOT eyes $8 as bullish momentum builds
Polkadot price analysis shows consolidation near the upper Bollinger Band, which indicates bullish momentum is intact. The price has consistently traded above the middle band (20-period SMA), reflecting ongoing support from buyers. However, the proximity to the upper band suggests that the asset might be approaching overbought levels in the short term, increasing the probability of a minor pullback or consolidation.
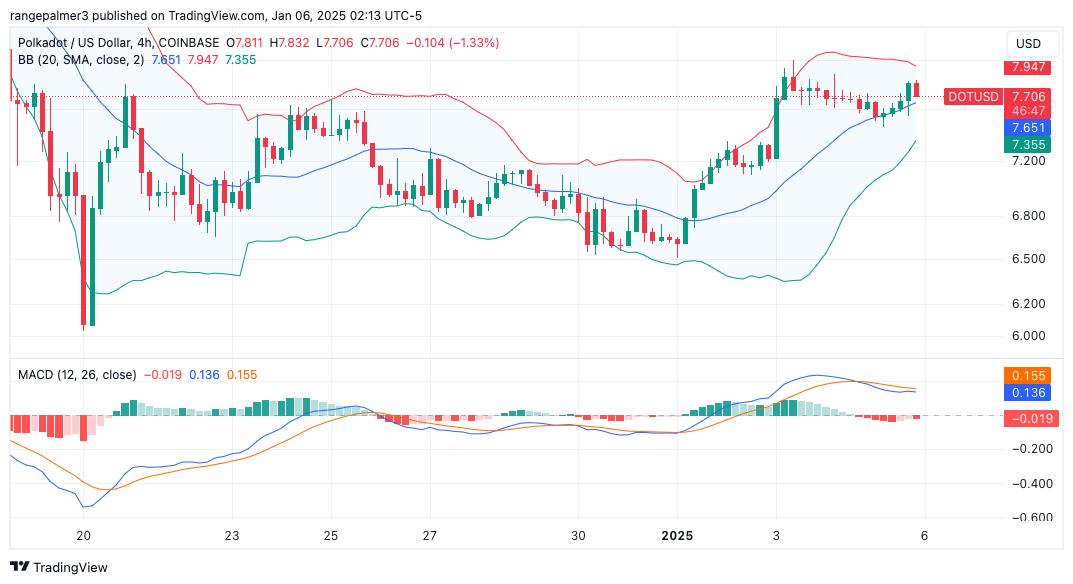
The MACD (Moving Average Convergence Divergence) indicator shows continued bullish momentum, with the MACD line above the signal line and a steady stream of green histogram bars. This signals strong market sentiment, though the narrowing gap between the MACD and signal lines suggests the bullish momentum might be losing steam slightly, indicating the potential for sideways movement before another push upward.
The immediate support is at $7.65 (middle Bollinger Band level), and a drop below this could lead to a test of the $7.35 level (lower Bollinger Band). On the upside, resistance lies at $7.95, a key level marked by the upper Bollinger Band. If DOT breaks through this resistance, it could rally toward the psychological barrier of $8.00. Traders should monitor the Bollinger Bands’ width, as narrowing bands may indicate reduced volatility and potential consolidation while widening bands could signal an impending breakout.
What to expect from Polkadot price analysis
Polkadot price analysis today shows DOT is trading above $7.70, after establishing a solid support at $7.50.The technical indicators suggest the possibility of a brief slowdown or consolidation before the next leg up. Additionally, rising trading volumes indicate strong market participation, which supports the likelihood of a sustained rally.
If Polkadot sustains its momentum and breaks past the $7.80 resistance, it could test the $8.00 level, signaling the start of a broader rally. However, a failure to hold key support levels may result in a pullback, allowing investors to reassess the market sentiment.
Polkadot technical indicators: Levels and action
Daily simple moving average (SMA)
| Period | Value ($) | Action |
| SMA 3 | $ 7.81 | SELL |
| SMA 5 | $ 7.59 | SELL |
| SMA 10 | $ 7.33 | SELL |
| SMA 21 | $ 7.71 | SELL |
| SMA 50 | $ 7.74 | SELL |
| SMA 100 | $ 6.04 | BUY |
| SMA 200 | $ 5.71 | BUY |
Daily exponential moving average (EMA)
| Period | Value ($) | Action |
| EMA 3 | $ 7.46 | SELL |
| EMA 5 | $ 7.80 | SELL |
| EMA 10 | $ 8.28 | SELL |
| EMA 21 | $ 8.46 | SELL |
| EMA 50 | $ 7.55 | SELL |
| EMA 100 | $ 6.57 | BUY |
| EMA 200 | $ 6.15 | BUY |
Is Polkadot a good investment?
Investing in Polkadot offers advantages for those interested in advanced blockchain solutions. Its multi-chain framework enables interoperability and scalability through its innovative relay chain and parachain architecture, improving transaction efficiency. The platform’s para-chain slot auction system allows democratic participation, and holding DOT tokens grants governance rights, giving investors a voice in the network’s future. These features make Polkadot a strategic addition for investors looking to capitalize on cutting-edge blockchain technology and the potential for future digital transformation.
Will Polkadot recover?
Polkadot (DOT) shows signs of recovery with a recent upward trend. If positive market conditions continue, Polkadot has the potential for further recovery.
Will Polkadot reach $10?
Yes, according to the long-term predictions, Pollkadot is projected to reach up to $10 by 2026.
Will Polkadot reach $100?
Reaching $100 for Polkadot (DOT) is highly ambitious and unlikely in the near term.
Does Polkadot have a good long-term future?
Based on the recent upward movement of DOT, Polkadot has a promising long-term future.
Recent news/opinion on Polkadot
- Hydration launches its decentralized borrowing platform on Polkadot, offering innovative DeFi tools like on-chain prioritized liquidations for enhanced security
Hydration has launched its decentralized borrowing platform, the Hydration Money Market, on the Polkadot blockchain. This platform allows users to deposit cryptocurrency as collateral, earn interest, and borrow digital assets. It includes innovative features such as over-collateralized borrowing and on-chain prioritized liquidations, enhancing security and efficiency in DeFi transactions.
Hydration aims to expand financial accessibility and innovation, leveraging Polkadot’s features for a robust, user-centric DeFi ecosystem.
Polkadot price prediction January 2025
Polkadot (DOT) is expected to exhibit a range of price movements in January 2025. The potential low is $6.24, while the average price might be around $7.45. On the higher end, DOT could reach up to $8.50.
| Month | Potential Low | Potential Average | Potential High |
| January | $6.24 | $7.45 | $8.50 |
Polkadot price prediction 2025
DOT price prediction in 2025 expects DOT to have a minimum value of $7.20 and a maximum value of $9.25. The coin’s average value could be around $7.50.
| Polkadot Price Prediction | Potential Low | Potential Average | Potential High |
| 2025 | $7.0 | $7.50 | $9.25 |
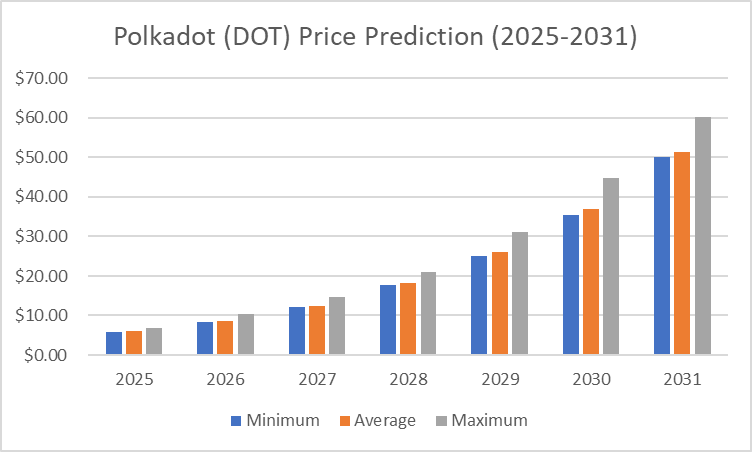
Polkadot Price Predictions 2026-2031
| Year | Minimum Price | Average Price | Maximum Price |
| 2026 | $8.37 | $8.67 | $10.25 |
| 2027 | $12.13 | $12.48 | $14.63 |
| 2028 | $17.68 | $18.31 | $21.09 |
| 2029 | $25.17 | $26.09 | $31.15 |
| 2030 | $35.52 | $36.82 | $44.65 |
| 2031 | $49.99 | $51.46 | $60.30 |
Polkadot price prediction 2026
According to the Polkadot price forecast for 2026, DOT could reach a maximum price of $10.25, a minimum price of $8.37 in 2025, and an average forecast price of $8.67.
Polkadot price prediction 2027
The price of Polkadot is predicted to reach a minimum value of $12.13 in 2027. Per expert analysis, DOT tokens could reach a maximum value of $14.63 and an average trading price of $12.48.
Polkadot price prediction 2028
Per the DOT price prediction for 2028, Polkadot is predicted to reach a minimum price level of $17.68, a maximum price of $21.09, and an average trading price of $18.31.
Polkadot price prediction 2029
The price of Polkadot is predicted to reach a minimum value of $25.17 in 2028. Traders can anticipate a maximum value of $31.15 and an average trading price of $26.09.
Polkadot price prediction 2030
According to the Polkadot price prediction for 2030, DOT could reach a maximum price of $44.65, a minimum price of $35.52 in 2025, and an average forecast price of $36.82.
Polkadot price prediction 2031
In 2031, the price of Polkadot is predicted to reach a minimum level of $49.99. Should positive market sentiment persist, DOT can attain a maximum price of $60.30 and an average trading price of $51.46.
Polkadot market price prediction: Analysts’ DOT price forecast
| Firm Name | 2024 | 2025 |
| Gov.Capital | $8.20 | $11.56 |
| DigitalCoinPrice | $15.86 | $18.45 |
| Coincodex | $11.15 | $15.93 |
Cryptopolitan’s Polkadot (DOT) Price Prediction
Per Cryptopolitan’s DOT price forecast, the coin’s price is projected to trend upward, reaching as high as $8.25 in 2025 and attempting to reclaim $55.90 by 2031.
Polkadot historic price sentiment
- After spending most of the second half of 2020 trading around $4-$5, the price broke above the previous all-time high of $7 on December 29 and quickly reached the Polkadot price projection of $10.

- Polkadot experienced rapid growth, with its price climbing from around $3 in January to an all-time high of approximately $57.50 in May 2021.
- After the peak, the price declined sharply, falling to around $10 by July before partially recovering to over $40 in November 2021.
- In 2022, Polkadot price steadily declined, starting the year around $30 and dropping below $10 by mid-year.
- By the end of 2022, the price stabilized near $5 as bearish market conditions dominated the cryptocurrency space.
- The price of DOT hovered between $5 and $7 for most of 2023, reflecting a period of consolidation and limited market excitement.
- In January 2024, Polkadot’s price remained relatively stable, trading around the $5–$6 range.
- By July 2024, Polkadot showed slight signs of recovery, with its price rising to around $7–$8. This modest uptick was likely driven by increasing market interest.
- In December 2024, Polkadot showed signs of recovery, with its price climbing to around $10.4.
- As of January 2025, the current Polkadot price is at $7.70.
0
0


 Manage all your crypto, NFT and DeFi from one place
Securely connect the portfolio you’re using to start.


