While Traders Watch Price, Solana’s Real Growth Is Happening Elsewhere

0
0

Most people tracking Solana are staring at the wrong number. Yes, the price is moving — but the story that actually matters right now is unfolding in a corner of the blockchain that price charts alone cannot capture.
While retail traders debate whether SOL can hold above $68, something far more significant has quietly crossed a threshold that few outside institutional circles are talking about.
Solana’s Real World Asset value has surpassed $3 billion — a milestone that reframes the entire conversation about what this network is actually becoming.
The $3 Billion Signal That Changes Everything
The RWA chart tells a story that price alone never could. From near zero in January 2024, Solana’s tokenized real world asset value crawled to roughly $400 million by late 2024, then began a staircase climb through 2025 before absolutely launching into a near-vertical ascent from January 2026 onward, breaching $3 billion by June 2026.
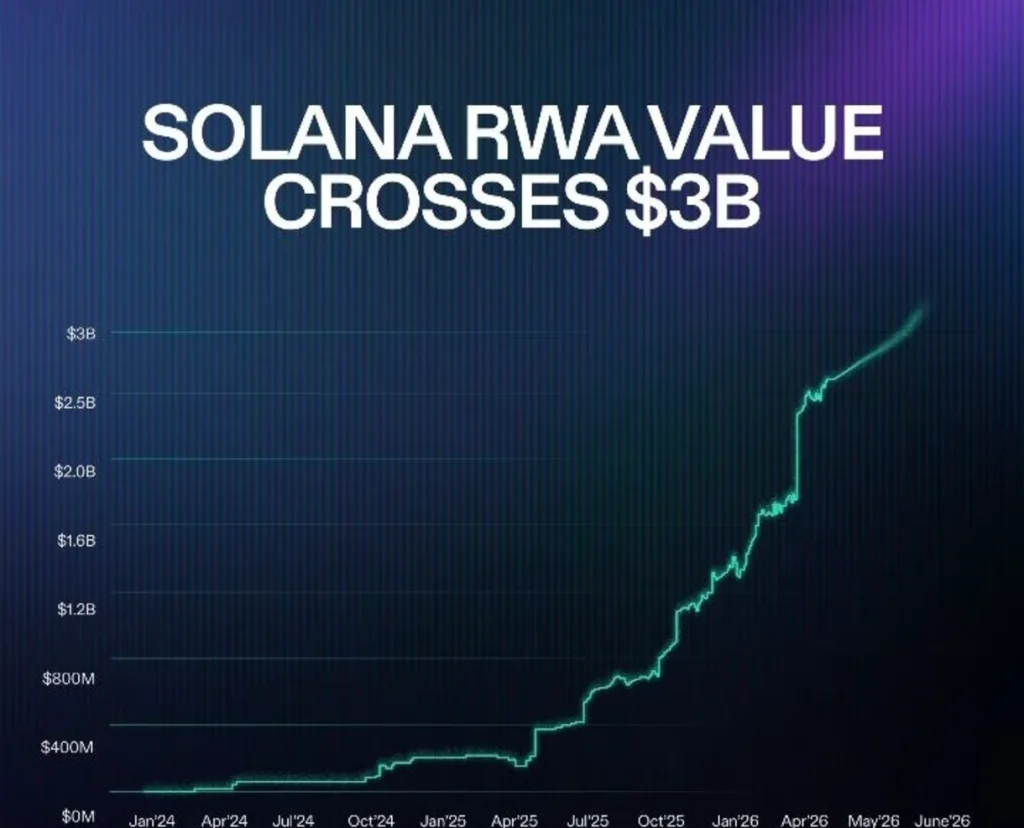
This is not speculative momentum — this is capital from the traditional financial world making a deliberate, structural move onto a blockchain network.
Tokenized treasury bills, private credit, commodities, and real estate are being settled on Solana at a pace that would have seemed implausible just eighteen months ago.
When institutional capital starts tokenizing real assets on a chain, it stops being a bet on crypto — it becomes a bet on infrastructure. That’s an entirely different category of investment.
So What Is the Price Saying?
Data pulled from CoinGecko on June 14, 2026 at approximately 07:25 UTC shows Solana trading at $68.33, up 6.4% over seven days.
The weekly chart reveals a sharp dip to around $62 on June 10 — likely a liquidity flush — before a strong recovery and push toward the $70 resistance level.
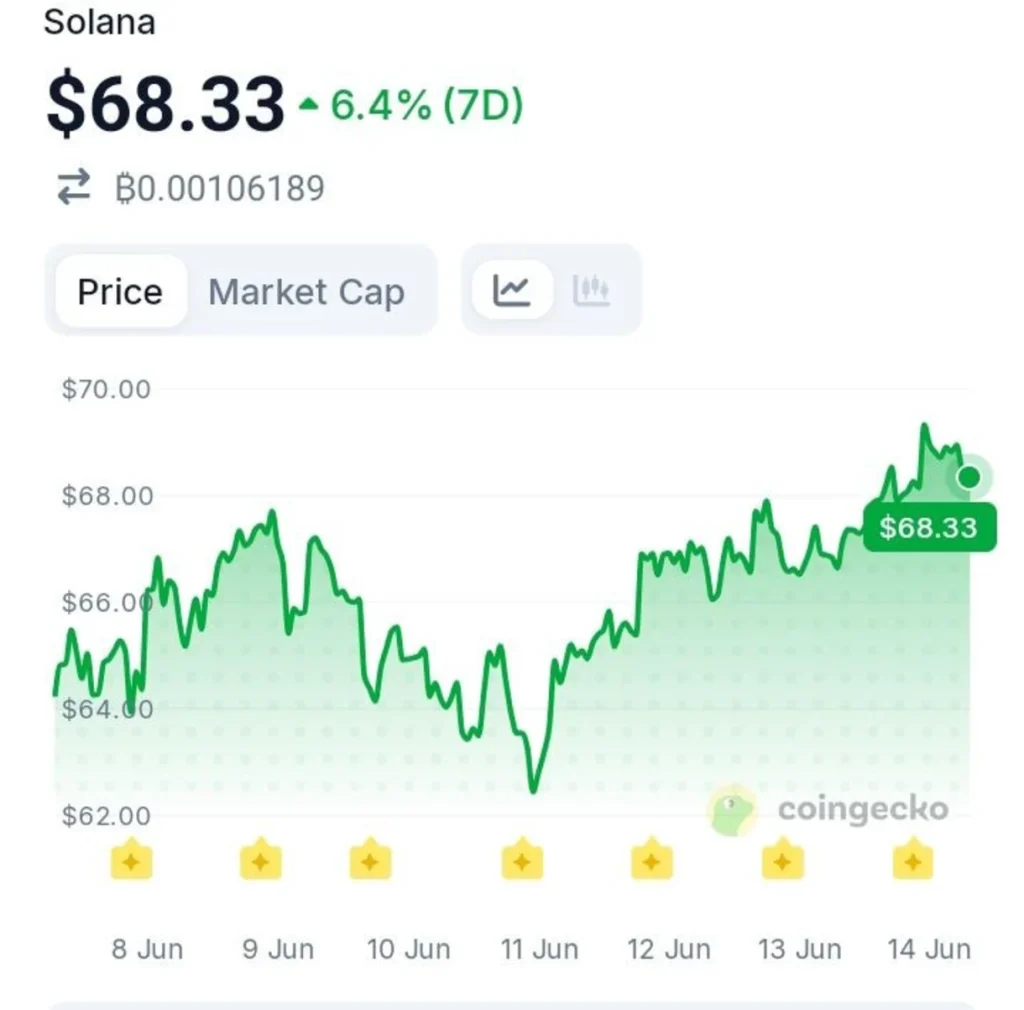
The structure is bullish, but more importantly, the price is now being supported by something sturdier than sentiment: genuine network utility and institutional demand.
Two Charts, One Conclusion
Most investors will only look at the price chart. The ones paying attention to the RWA chart are seeing something different — a network graduating from speculative asset to financial infrastructure, quietly and without fanfare.
The price of SOL may be $68 today. But if tokenized real world assets continue compounding at this rate on Solana’s rails, the more pressing question might not be where SOL is going — but whether the $3 billion was just the beginning.
Disclaimer:
This article is for informational purposes only and does not constitute financial, investment, or trading advice. The views expressed are based on publicly available data, market observations, and the author’s interpretation at the time of writing. Cryptocurrency markets are highly volatile and unpredictable, and past performance or current technical setups do not guarantee future results. Readers should conduct their own research and consult with a qualified financial advisor before making any investment decisions. TechGaged does not accept liability for any losses incurred based on the information presented.
The post While Traders Watch Price, Solana’s Real Growth Is Happening Elsewhere appeared first on TechGaged.com.
0
0


 Manage all your crypto, NFT and DeFi from one place
Securely connect the portfolio you’re using to start.

0
0

0
0

0
0

0
0