
Chainlink Price Prediction 2027: Is LINK Repeating Its Old Cycle?

0
0

Chainlink is trading at $7.68 right now, down close to 5% this week. That's not a great-looking candle on its own, but zoom out to the weekly chart and this drop starts to look a lot more familiar.
That's really the whole idea behind this Chainlink price prediction 2027 outlook.
LINK has been here before, sitting in almost the exact same spot on the chart, and what happened last time is worth knowing before writing this pullback off as just more weakness.
Chainlink Price Today Outlook
Metric | Value |
Current Price | $7.68 |
Market Cap | $5.74B |
24h Volume | $224.52M |
Total Supply | 1,000,000,000 LINK |
Circulating Supply | 748,099,970 LINK |
About 75% of LINK's total supply is already circulating, so there's no major unlock event waiting to flood the market. Whatever happens with this Chainlink price prediction in 2027 comes down to how buyers and sellers behave at this level, not some hidden supply shock later.
The Setup: LINK Has Done This Before
Rewind to between May 2022 and October 2023, and LINK spent a long stretch just sitting in one tight range, going nowhere fast. It wasn't an exciting chart to watch back then.
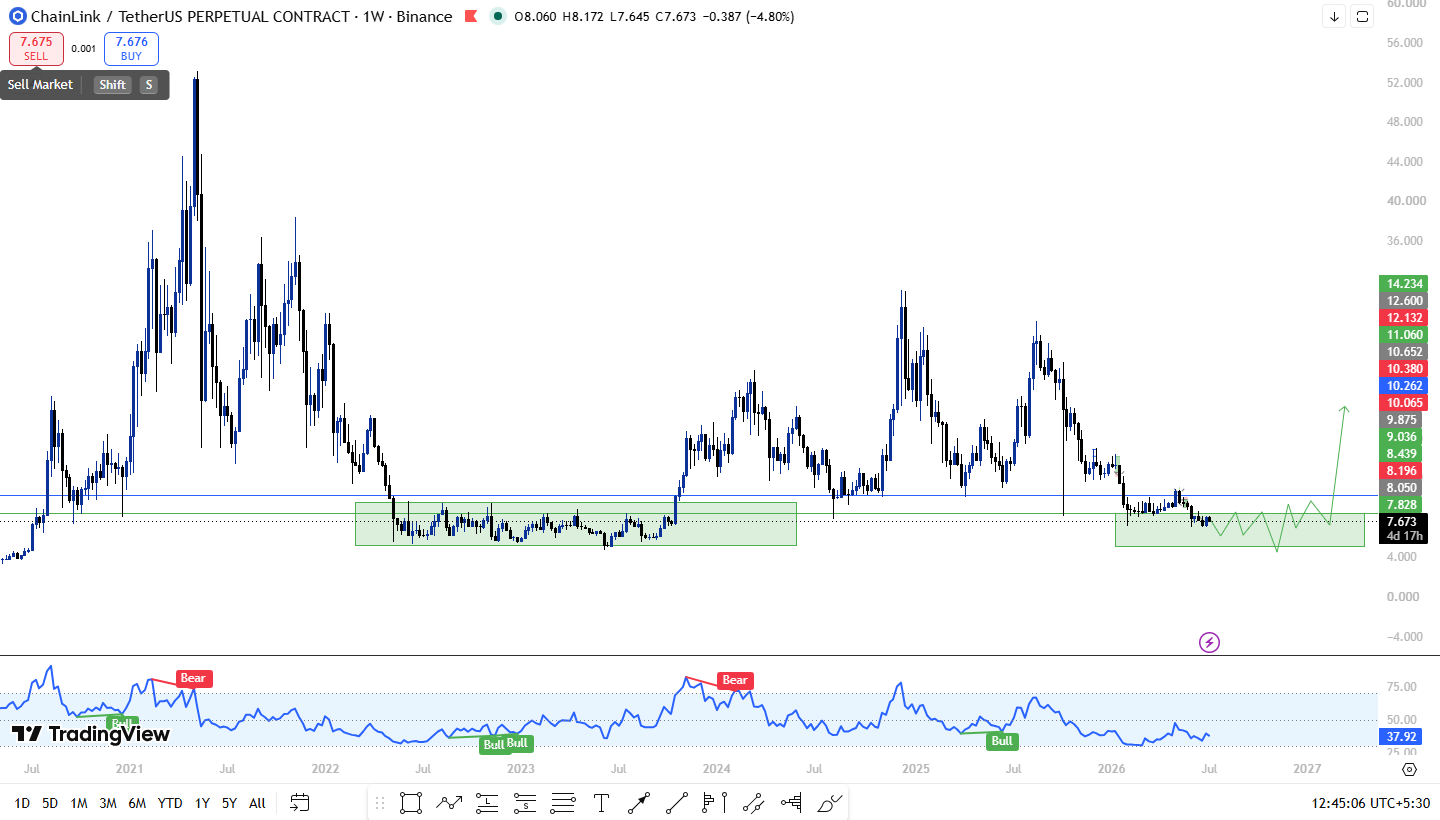
But right before it finally moved, sellers got one last push down, a liquidity sweep that shook out anyone still holding on for a bounce.
That sweep turned out to be the setup, not the breakdown. Once it was done, $LINK broke out of that range and ran hard, delivering close to a 600% return off that accumulation zone before the rally finally cooled off.
Now here's the part that matters. $LINK has come right back down to a support zone that looks a lot like that old one.
Price is sustaining in this area again, and the pattern that played out before, a shakeout low before the real move, is exactly the kind of setup traders are watching for right now.
What a Repeat of This Cycle Could Look Like
If this plays out the same way it did last time, the sequence would look something like this: one more push down that sweeps out weak hands (what's often called a fake breakdown), followed by LINK reclaiming this zone and sustaining above it again.
That reclamation is the signal that would matter most.
It's not just about the price bouncing once; it's about $LINK holding this zone afterward the same way it did between 2022 and 2023, before the bigger move actually got going.
If history repeats even loosely, a similar percentage move off this zone would put LINK's long-term target well above where most people are currently expecting it to go.
What If It Doesn't Repeat?
Not every setup that looks similar plays out the same way twice. If LINK breaks down through this support zone without a proper reclaim,
That would invalidate the comparison to 2022–2023, and the more likely path becomes an extended period of chop or a deeper slide before any real recovery attempt.
The key difference between a real fake breakdown and an actual breakdown is what happens after the dip; a quick recovery and a hold above the zone points to the old pattern repeating, while a slow bleed lower with no reclaim points to genuine weakness instead.
Chainlink Price Prediction Table: 2026 to 2027
Timeframe | What's Happening | Bear Case | Bull Case | What Needs to Happen |
Q3 2026 | Testing the support zone | $6.50 | $9.00 | Area holds, no clean breakdown |
Q4 2026 | Possible shakeout and reclaim | $6.00 | $11.00 | A fake breakdown plays out, LINK reclaims the zone |
Q1 2027 | Early recovery phase | $8.00 | $15.00 | Area reclaim confirmed; broader market improves |
Q2 2027 | Cycle repeat attempt | $10.00 | $25.00 | LINK follows a similar path to its 2023–2024 breakout |
The Honest Risk and Reward
What's In Play | Bullish Scenario | Bearish Scenario |
This support zone | Holds, fake breakdown clears out sellers | Breaks cleanly; no reclaim follows |
Comparison to 2022–2023 cycle | A pattern repeats, and a big move follows | Setup fails; this time is different |
Liquidity sweep behavior | Shakes out weak hands, then reverses | Turns into a genuine breakdown instead |
Short-term momentum | Stabilizes after the current pullback | Keeps sliding, no signs of a bottom |
Bitcoin's 2027 cycle | LINK rallies alongside the broader market | BTC weakness drags altcoins lower with it |
What to Watch Going Forward
The most important thing to track here is whether LINK dips a bit further, sweeps out the last of the sellers, and then reclaims this zone and holds above it.
That combination, a shakeout followed by a real reclaim, is what separates a healthy setup from an actual breakdown.
On the other side, if LINK just keeps sliding through this zone without any real recovery attempt, that would be the sign this comparison to the old cycle isn't playing out, and a longer, deeper correction becomes the more likely path instead.
Expert view
Traders watching LINK's weekly chart have pointed out how closely the current setup resembles the range LINK spent in before its last major breakout, right down to the shakeout low that came just before the move actually started.
That's the main reason some are treating this pullback as a potential setup rather than a warning sign, though the comparison only holds if LINK actually reclaims the zone rather than breaking down through it.
Conclusion:
Chainlink's 2027 outlook hinges on whether this support zone plays out the same way the 2022–2023 range did, a shakeout low followed by a reclaim and a sustained move higher.
If that pattern repeats, LINK's long-term targets could stretch well beyond current levels.
If the zone breaks down without a reclaim instead, a longer consolidation phase becomes the more likely outcome before any real recovery.
Disclaimer: This article is written for educational and informational purposes only.
Nothing here is financial advice. Cryptocurrency markets are volatile and unpredictable.
0
0

 Manage all your crypto, NFT and DeFi from one place
Securely connect the portfolio you’re using to start.

0
0

0
0


0
0