
Bitcoin Price Today: BTC Holds $80,000 Before The Biggest Week Of The Month

0
0
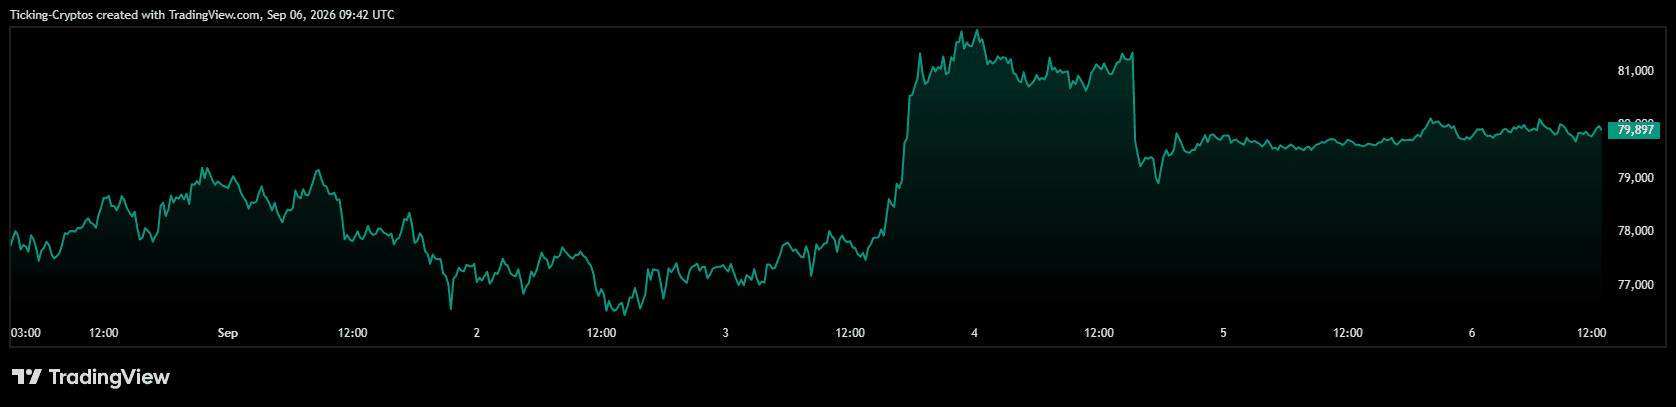
Bitcoin is trading at $79,985, up 0.36% in 24 hours and around 2.5% on the week. That flat number hides a violent five days. BTC touched $82,240 on Friday, its highest level since May, then lost more than 4% in the space of an hour. Everything now hangs on a single inflation print.
Where is the Bitcoin price today?
$BTC sits just above $79,900 with a market capitalisation of $1.6 trillion and 24-hour volume near $19.8 billion. The weekly gain of 2.5% makes Bitcoin one of the steadier large caps right now, but the year-to-date figure is still minus 8.6%.
That is the frame worth keeping. Bitcoin has recovered roughly 37% from its June low, and it is still deep in the red for 2026. This is a rebound inside a bear market until proven otherwise.
Why did the Bitcoin price fall after the jobs report?
Thursday set the trap. ADP employment came in at 38,000 against 47,000 expected, rate-hike expectations softened, and BTC broke $80,000 with roughly $93 million of short positions liquidated on the way up. It reclaimed the 200-day EMA for the first time since June. By early Friday in Europe it printed $82,240, a gain of 6.8% in 24 hours.
Then the August employment report landed. Nonfarm payrolls rose 162,000 against a consensus near 56,000, close to triple the estimate. Unemployment held at 4.1%, wage growth eased to 3.1% year on year, and June and July were revised higher by a combined 55,000 jobs.
$Bitcoin fell from $81,300 to $78,600 within minutes. CME FedWatch odds of a 25 basis point hike in September jumped from 49.4% to 58%. The ten-year Treasury yield sits at 4.73% and the thirty-year is at its highest level since 2007.
The logic is simple and it is not going away. Bitcoin pays no yield. When risk-free returns push toward 5%, holding a non-yielding asset costs more. A strong labour market is good news for the economy and bad news for anyone waiting on cheap money.
Are Bitcoin ETF inflows still supporting the price?
Yes, and this is the strongest argument for the bull case right now.
US spot Bitcoin ETFs took in a net $730.8 million on September 3, the largest single day since January, with BlackRock's IBIT accounting for $454 million of it. On the day of the selloff itself the desks bought again: $174.6 million net on September 4, a third straight session of inflows, taking the three-day total to roughly $1.01 billion.
The context matters. Spot Bitcoin ETFs have shed a net $4.83 billion across 2026 as a whole. August flipped positive and recovered a meaningful chunk. Institutions are not buying blindly anymore, they are buying weakness and trimming into strength. But the bid is real, and it absorbed a hawkish repricing without breaking the range.
What Bitcoin price levels matter this week?
On the three-hour chart the structure is intact. The 200 EMA sits at $74,971 and is rising, around $5,000 below spot. Bitcoin has held above it continuously since the vertical move from $64,000 to $77,000 between August 19 and 21.
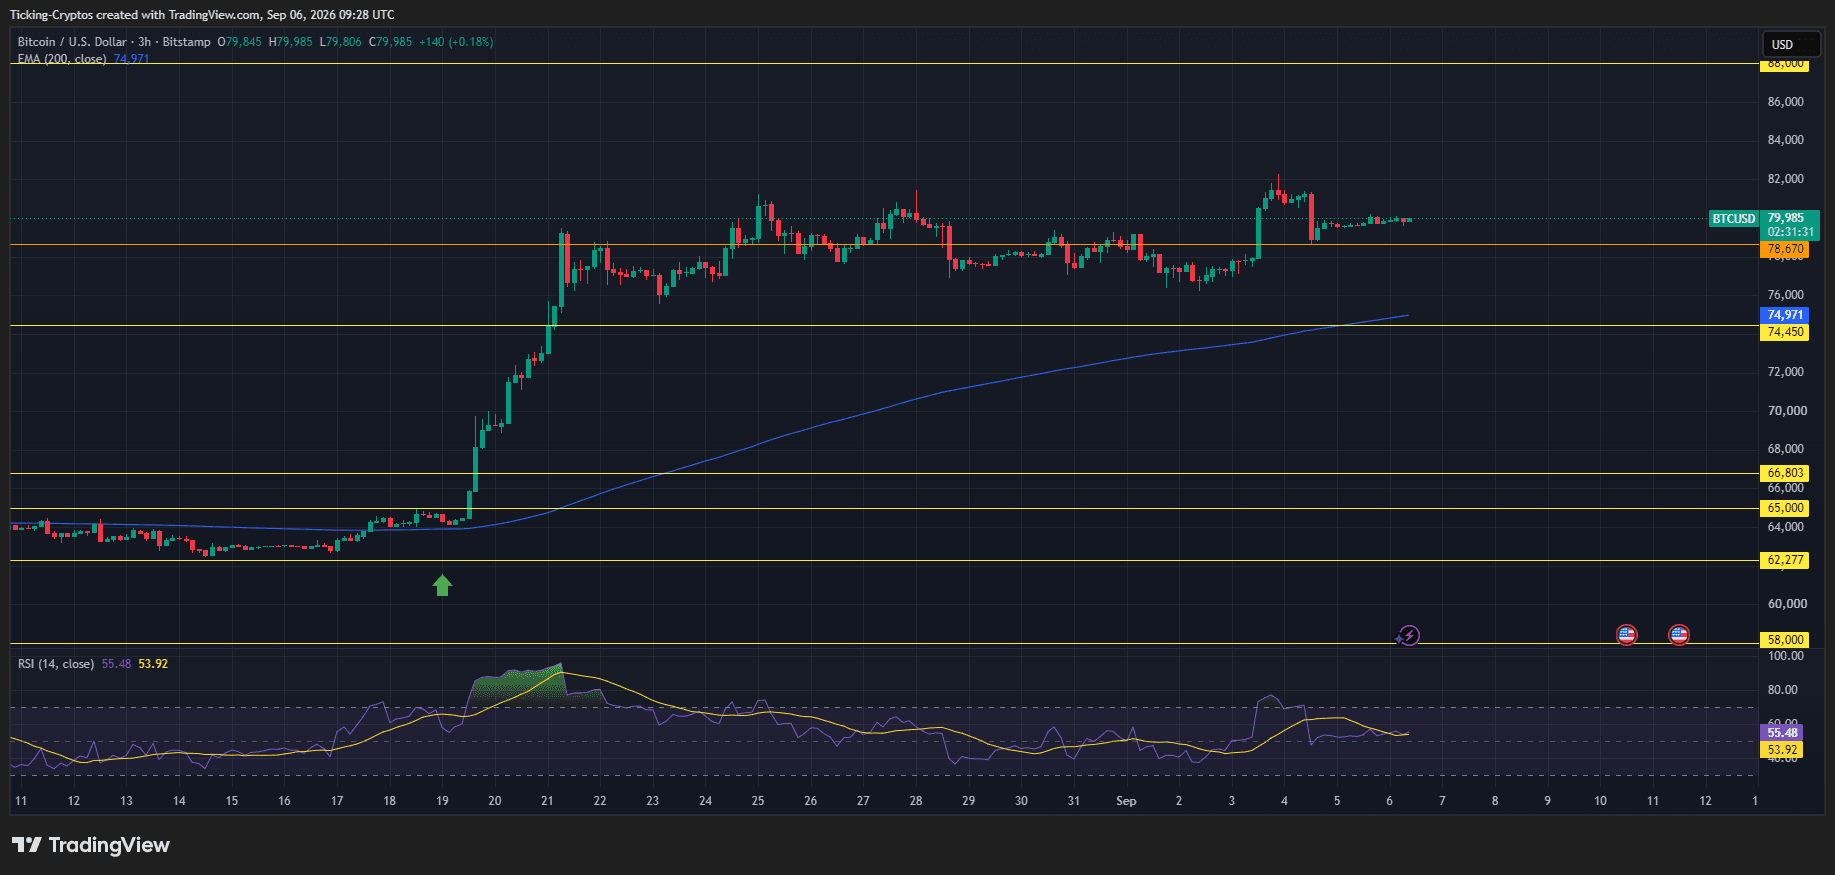
Since then BTC has been boxed between roughly $76,000 and $82,200.
- First support: $78,670. The line directly beneath price, flipped from resistance to support in early September. It sits close to the $78,000 max pain level for the September 18 options expiry, which tends to act as a magnet into expiry week.
- Next support: $76,000 to $77,000. Losing this shelf opens the gap toward the EMA cluster at $74,971 and the $74,450 line.
- First resistance: $82,200. Friday's high at $82,178 was the fourth failed attempt at the top of the range.
- The level that changes the story: $85,000. A weekly close above it would be the first real evidence that this is more than a bear market rally. The band up to $88,000 is the next obstacle after that.
- Structural line: $58,000. Only relevant if the entire recovery fails.
RSI reads 55.48 against a 53.92 signal line. Neutral, no divergence, no exhaustion. The candles since Friday are tiny and coiling directly on $78,670, which is textbook compression ahead of a data release.
Which news could move the Bitcoin price next week?
Four dates, in order of importance.
- September 11: US CPI. The single most important number of the month. Fed Governor Christopher Waller has said he would consider a hike if August inflation runs hot, which turns this print into the decider rather than a data point. A soft number takes the September hike off the table and gives Bitcoin room to attack $82,200. A hot number puts $76,000 in play quickly.
- September 15: the Clarity Act. SEC Chair Paul Atkins expects a Senate vote and has urged lawmakers to pass the bill before the month ends. He also confirmed the SEC is drafting its own complementary crypto legislation. Regulatory clarity is a slower-burning catalyst than CPI, but it is the one that shapes institutional allocation into 2027.
- September 15 to 16: the FOMC decision. The first hike under serious consideration since the tightening cycle ended in July 2023. Markets price it at 58%. Note that a hike being priced is not the same as a hike being absorbed. If the Fed hikes and signals more, the reaction is not in the current price.
- September 18: September options expiry. Max pain at $78,000. Expect price to gravitate toward that area into Friday unless CPI overwhelms it.
One more for the calendar: the MultiversX Supernova hard fork goes live on September 10, cutting block time from six seconds to 600 milliseconds. Not a BTC catalyst, but a real event for anyone holding EGLD on an exchange.
Bitcoin Price Prediction: What does this mean Bitcoin price?
Bitcoin is caught between two forces that are both genuine. Institutional demand through the ETFs is steady and absorbed a hawkish shock without a breakdown. Rate expectations are moving the wrong way, yields are at multi-year highs, and oil above $90 is adding to the inflation problem that started this whole chain.
The chart has no opinion, which is the honest read. Neutral RSI, intact trend, compressed range. Direction gets decided by Thursday's inflation number, not by anything technical.
Practical takeaway: $78,670 holding through CPI keeps the recovery structure alive. A weekly close above $85,000 confirms it. A break below $76,000 means the August rally was the bounce, not the bottom.
0
0

 Manage all your crypto, NFT and DeFi from one place
Securely connect the portfolio you’re using to start.


