Does Toncoin’s Crash of 40% Signal Another Downside?

0
0

NOIDA (CoinChapter.com)— The Open Network’s Toncoin (TON) price crashed nearly 41% from its recent all-time high of $8.8 on April 11 to reach a daily low near $5.2 on April 30. Recently, scammers exploited Telegram users interested in The Open Network blockchain by promoting a referral scheme to steal Toncoin. The scammers lured victims with a fake Telegram bot, urging them to buy Toncoin and link Web3 wallets.
Following Toncoin’s recent crash, TON is on the precipice of confirming a bearish pattern.
Bearish Pattern Could Chop Ton Price’s Head Off
The Toncoin price is moving inside a bearish technical setup called the ‘head and shoulders pattern.’
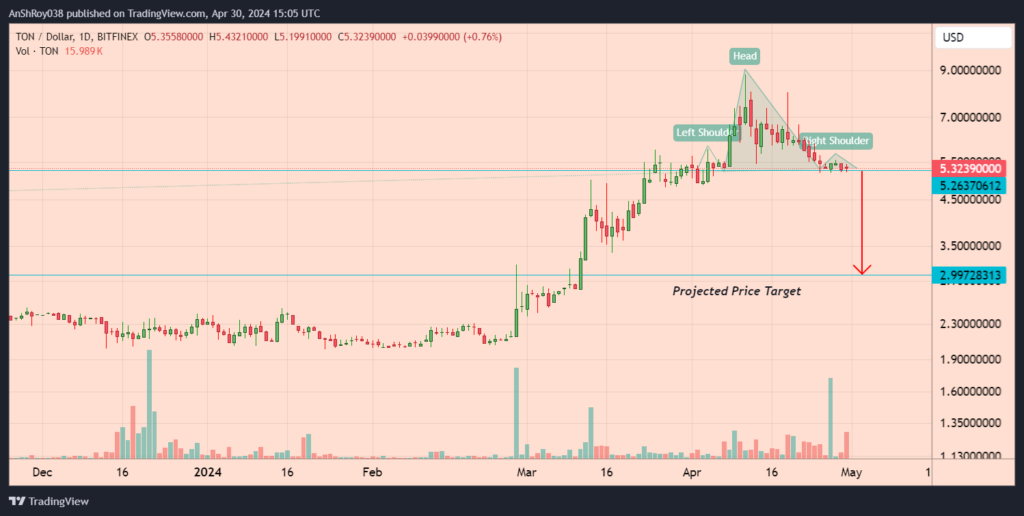
Market participants have traditionally considered the Head and Shoulders pattern as a significant reversal configuration in technical analysis, signaling a potential shift from an uptrend to a downtrend in market prices.
Three distinct and consecutive peaks on a chart form the pattern, with the central peak, known as the Head, standing taller than the two flanking peaks, called the Shoulders.
The first Shoulder forms when prices rise to a peak and subsequently retreat to a level of support, which later acts as the ‘Neckline‘ for the entire formation. Following this initial decline, prices surge to create the highest peak, the Head, before retreating back to the level of the Neckline.
Finally, the rise and subsequent fall of the second Shoulder completes the pattern, which typically aligns in height with the first shoulder and returns to rest at the neckline.
Breaking below the Neckline confirms the pattern, with the price target equal to the distance between the highest point of the Head and the Neckline. Per the rules of technical analysis, TON price risks dropping 45% from the Neckline to reach the theoretical price target near $3.
TON Bulls Holding On To Trendline Support For Dear Life
Toncoin bulls struggle to keep the token’s price above the 50-day EMA (purple wave) dynamic support, failing which could force the TON price to test the support level near $4.7.
The altcoin’s price dropped nearly 3% on April 30, and a further downtrend could result in TON’s price confirming the bearish pattern it has formed.
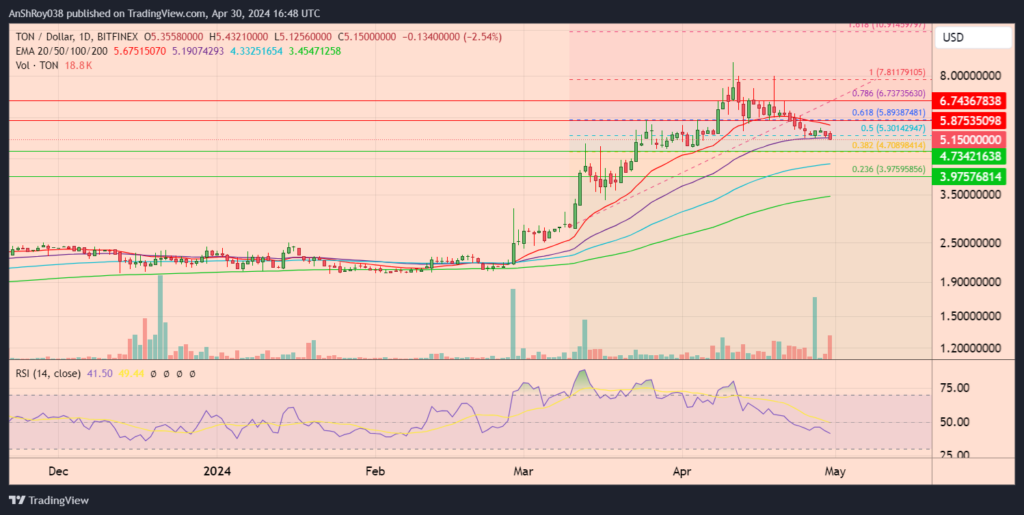
As a result, TON price could drop to the support near $4 before recovering.
On the other hand, a whiff of bullish cues could help the token rally to the 20-day EMA (red wave) resistance near $5.9. Moreover, breaking and consolidating above the immediate resistance might help Toncoin price target the resistance near $6.7.
The relative strength index for Toncoin remained neutral, with a score of 41.5 on the daily charts.
The post Does Toncoin’s Crash of 40% Signal Another Downside? appeared first on CoinChapter.
0
0

 Manage all your crypto, NFT and DeFi from one place
Securely connect the portfolio you’re using to start.