PI dips below $0.19 as social interest fades: check forecast

0
0

PI has been declining since the Pi day celebration, losing over 40% of its value over the past ten days.
The coin has dropped by nearly 4% over the last 24 hours and is currently trading between the 50-day and 100-day Exponential Moving Averages (EMAs).
The declining social interest in Pi Network and a surge in PI token deposits on Centralized Exchanges (CEXs) flag downside risk.
Furthermore, the technical outlook for Pi Network remains bearish, with momentum indicators suggesting further downward movement in the near term.
PI dips from March 13 high as social interest declines
PI has been on a steady decline over the past few days after rallying earlier this month. The coin is down 3% in the last 24 hours and is now trading below $0.1900 per coin.
The bearish performance comes as Santiment data shows a sudden decline in Pi Network's social dominance to 0.025% among the top 100 cryptocurrencies.
A decline in Pi Network's media exposure signals downside risk, with the coin largely a speculative token driven by its community.
Furthermore, PiScan data shows 1.43 million PI tokens deposited in the last 24 hours.
The increase in exchange deposits suggests a potential profit-taking phase by US investors after the listing on Kraken Exchange.
Kraken recorded over 60,000 PI token inflows and over 2 million PI tokens on the OKX exchange in the same period.
The consistent increase in PI deposits on centralized exchanges could add further selling pressure on the coin.
However, a rebound in Pi Network's social dominance could reverse the selling pressure and allow PI to recapture its recent monthly high.
Technical outlook: Could PI lose $0.175 support level?
The PI/USDT 4-hour chart remains bullish and efficient despite the 40% decline over the past ten days.
The coin is down nearly 4% in the last 24 hours, extending its losses after a 7% decline last week.
PI has now dropped below the 50-day Exponential Moving Average (EMA) at $0.1895.
The 50-day EMA now serves as a near-term resistance, with another major resistance around the 100-day EMA at $0.1980.
Furthermore, the overhanging 200-day EMA keeps the broader trend bearish.
The Moving Average Convergence Divergence (MACD) line is below the signal line, suggesting a bearish momentum.
The Relative Strength Index (RSI) at 53 is approaching the neutral zone, down from the overbought signal recorded two weeks ago.
It reinforces a lack of strong upside momentum as the price fades from the recent swing high.
If the bulls hold the $0.175 support level in the near term, PI could rally towards the 100-day EMA at $0.1980, easing the downside bias.
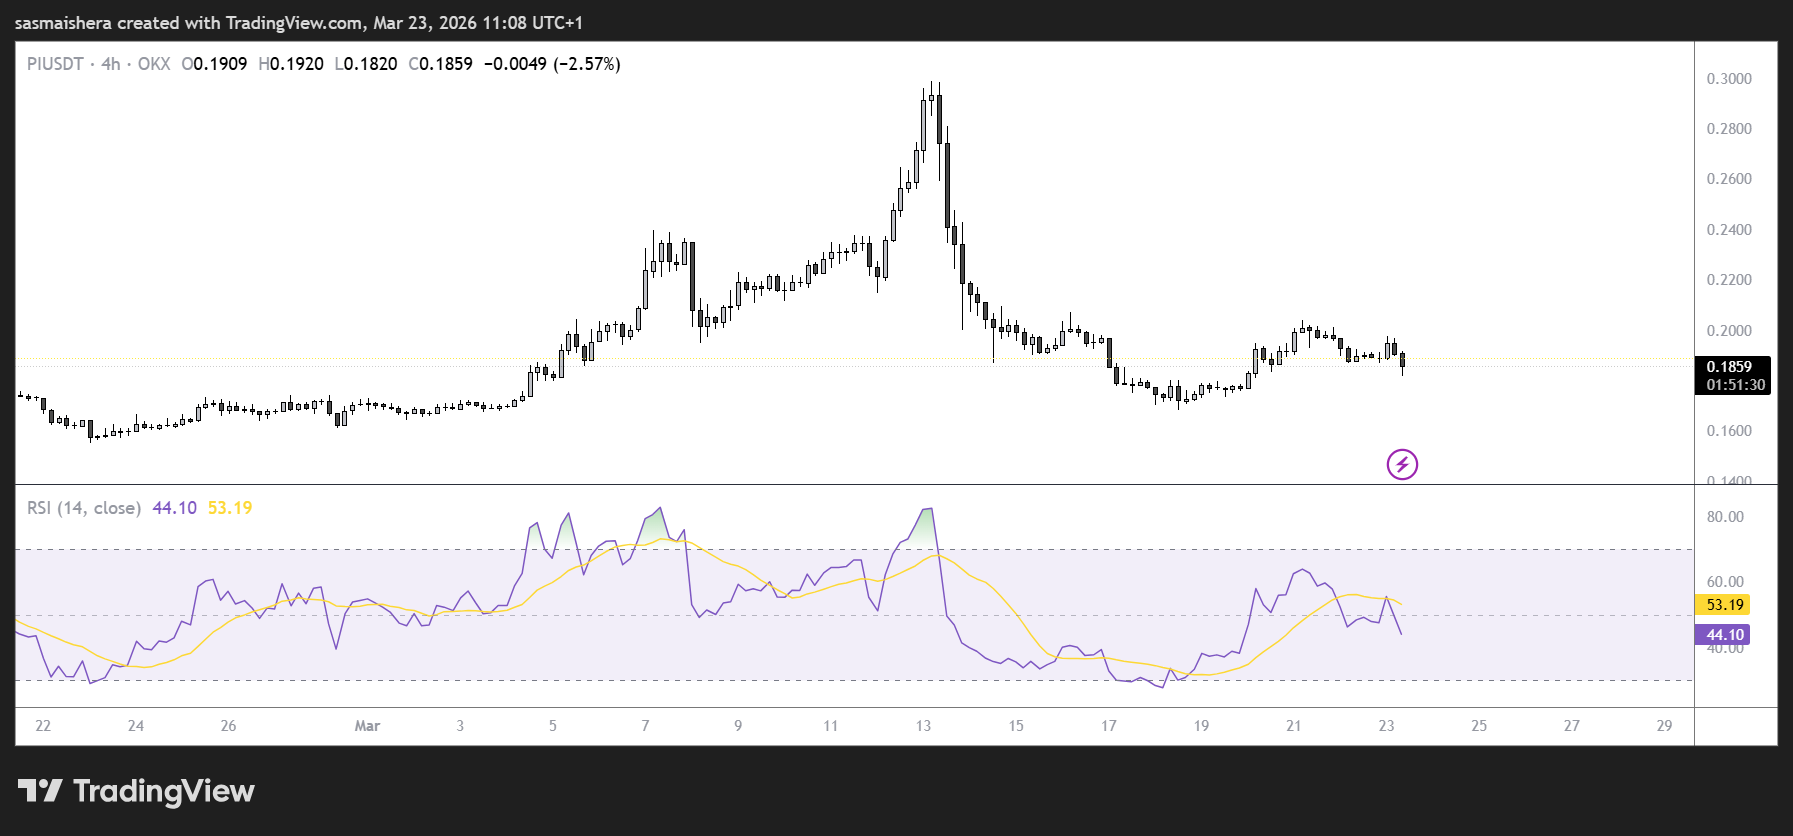
This would allow the bulls to make an attempt toward the March 7 high at $0.2396. A stronger recovery would meet further resistance around the 200-day EMA at $0.2745.
With the bears breaking the $0.1895 support, further downward movement could see the $0.1736 region come into focus.
The post PI dips below $0.19 as social interest fades: check forecast appeared first on Invezz
0
0


 Manage all your crypto, NFT and DeFi from one place
Securely connect the portfolio you’re using to start.

0
0

0
0


0
0