
Shiba Inu Price Prediction: $0.00000723 Bounce or $0.00000405 Drop?

0
0

Shiba Inu slipped 2.6% in 24 hours. Yet 3,300 fresh holders still joined in two weeks.
That tug of war frames this Shiba Inu price prediction.
Shiba Inu launched in August 2020 as an Ethereum meme token from an anonymous developer.
Two ecosystem pieces followed. Shibarium is a faster network built on Ethereum, and Shibburn tracks coins removed from supply.
The Shiba Inu price today sits at $0.00000558, with a market cap (total value of circulating coins) of $3.291B as of Sep 29, 2026, 04:01 UTC.
That's roughly 94% below the October 2021 peak, which leaves a very long road back.
Shiba Inu Price Today: Live Market Data
Metric | Value |
Price | $0.000005585 |
24h Change | -2.6% |
24h Range | $0.00000550 to $0.00000576 |
Market Cap | $3.291B |
Source: market data taken from CoinGecko, as of Sep 29, 2026. Figures may vary slightly across other tracking websites.
Price sits in the lower third of the 24-hour range.
Trading volume, the value of SHIB trading in a day, reached $105.015M, about 3.2% of market cap. Basically, participation is steady but not surging.
Fully diluted valuation, the market value if every existing coin counted, sits at $3.293B. Turns out, 589.239T of 589.496T SHIB already circulates.
Shiba Inu News: Holder Count Nears 1.7 Million
Breaking: Shiba Inu news just landed. Holders near 1.7 million.
Etherscan data shows more than 1.69M holders. That's 3,300 added in two weeks, per BSCN.
Source: Data Taken From @BSCNews, X Account, as of Sep 29, 2026
Quick math tempers the timeline. From exactly 1.69M at that pace, 1.7M needs about six weeks, not one month.
Noted. But holders aren't buyers on demand. A growing wallet count shows wider ownership, not guaranteed demand.
Shiba Inu Technical Analysis: Ascending Channel on the Daily Chart
When we pulled up the daily chart, one shape stood out. SHIB trades inside an ascending channel, two rising parallel lines forming a floor and a ceiling.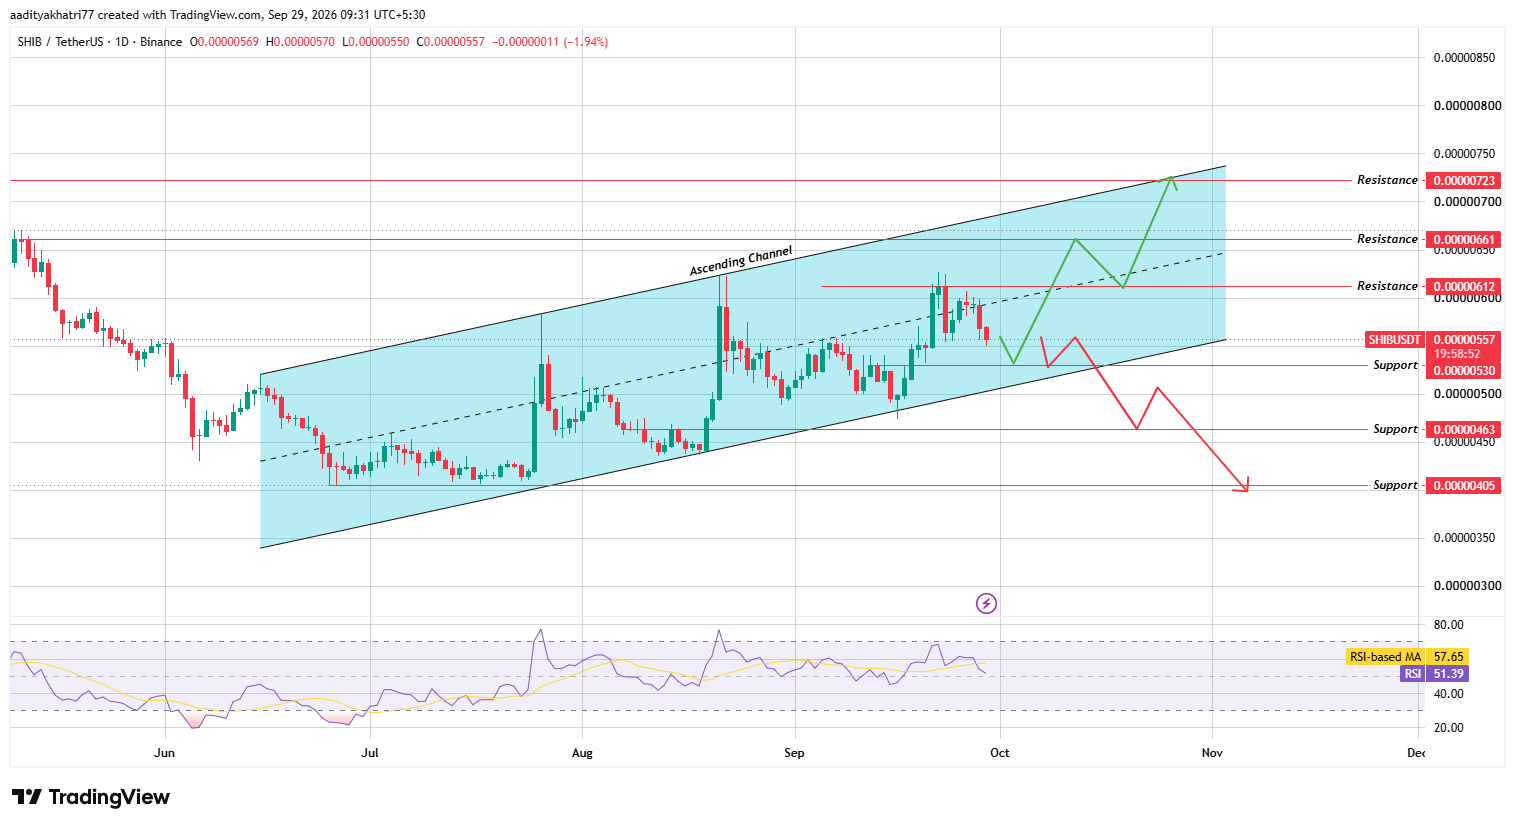
Source: Chart taken from TradingView, as of Sep 29, 2026
This Shiba Inu technical analysis rests on that channel. Price is sliding toward $0.00000530 support, a level where buyers have stepped in before.
Three resistance levels sit above, where sellers tend to appear: $0.00000612, $0.00000661 and $0.00000723, the last at the channel ceiling.
The price seems weak at first glance. Actually, scratch that: weakness only counts if $0.00000530 breaks.
Here's the thing: the structure still favors buyers while the channel floor holds. Bias stays cautiously bullish, though momentum needs to improve.
The next move hinges on one level: $0.00000530.
Shiba Inu RSI: Momentum Is Cooling
The Relative Strength Index (RSI) scores momentum from 0 to 100. Above 70 flags overheated buying, and below 30 flags heavy selling.
When we checked the daily RSI, it read 51.39.
Its moving average, a smoothed average of recent readings, sits higher at 57.65.
Turns out, momentum has cooled more than price suggests.
But cooling isn't collapsing. Neutral, leaning soft, with buyers still in the game.
Can Shiba Inu Coin Bounce From $0.00000530 Support?
A bounce from $0.00000530 would put the Shiba Inu coin back on the channel's upward path. That's about 4.8% below current trades, so the test is near.
Price needs one thing a bounce.
First level: $0.00000612, near mid-channel and about 9.9% above current trades. A daily candle that trades and holds above it, with volume well past today's $105.015M, would confirm strength.
What we're watching is volume, not just price.And beyond $0.00000612 sits $0.00000661, then the channel ceiling near $0.00000723, roughly 29.8% higher. A bounce without volume proves little.
What Happens If Shiba Inu Breaks Support?
So what if the bounce never arrives?
A daily candle trading below $0.00000530 and the channel floor would flip the bias. Fast.
Then $0.00000463 comes first, about 16.9% below current trades. Sellers want a break, and a break opens that door.
And $0.00000405 waits below that, roughly 27.3% lower. Buyers have a job here. Defend $0.00000530.
Shiba Inu Price Levels: Support and Resistance
Support | Resistance |
$0.00000530 | $0.00000612 |
$0.00000463 | $0.00000661 |
$0.00000405 | $0.00000723 |
These Shiba Inu price levels come straight from the daily chart.
Shiba Inu Price Prediction October 2026: Scenarios
Scenario | Setup | Level |
Bull | Bounce from $0.00000530, then reclaim | $0.00000612 to $0.00000723 |
Base | Range inside the channel | $0.00000530 to $0.00000612 |
Bear | Break of $0.00000530 and channel floor | $0.00000463, then $0.00000405 |
For the Shiba Inu price prediction October 2026, the base case is a range between $0.00000530 and $0.00000612.
The wider Shiba Inu price prediction 2026 stays constructive above $0.00000530.
SHIB vs Bitcoin
SHIB lost 2.3% against Bitcoin and 3.1% against Ethereum in 24 hours. It lagged both majors.
And smaller meme coins tend to swing harder when Bitcoin moves, so a sharp BTC swing could push SHIB through either level.
Disclaimer: This article isn't financial advice. SHIB is highly volatile, and a break below $0.00000530 could push losses toward $0.00000405. No outcome is guaranteed.
0
0


 Manage all your crypto, NFT and DeFi from one place
Securely connect the portfolio you’re using to start.


