
Hyperliquid Price Prediction 2029: Can HYPE Hit $300?

0
0

Hyperliquid is trading at $68.64, holding steady just under its all-time high on the weekly chart.
This Hyperliquid price prediction 2029 breakdown looks at that all-time high retest, the Fib extension targets sitting above the price, the critical support line below, and what a breakout could mean for HYPE's next multi-year move.
HYPE Right Now:
Metric | Value |
$68.64 | |
Market Cap | $15.25B |
FDV | $65.51B |
24H Volume | $354.89M (2.33% of Mkt. Cap.) |
Total Supply | 955,307,079 HYPE |
Circulating Supply | 222,445,714 HYPE |
HYPE's price is up 0.83% on the day, with volume relative to market cap sitting at a fairly normal 2.33%.
The price is consolidating rather than making a decisive move in either direction right now, keeping this Hyperliquid coin price prediction firmly in watch-and-wait territory.
Hyperliquid Price Prediction 2029: Sustaining Near the All-Time High
Pull up the HYPE weekly chart, and the price is currently holding its ground just under the all-time high, refusing to give up much ground despite the recent pullback from the highs.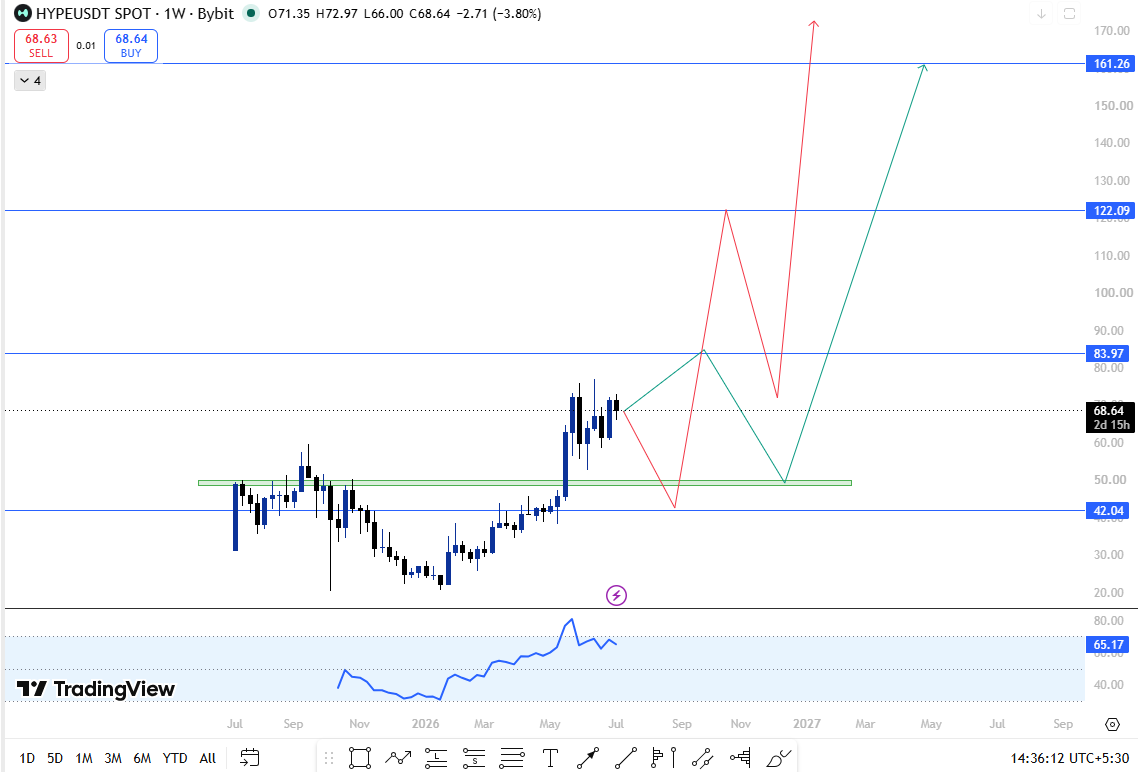
This HYPE technical analysis starts right at that level, since it has become the defining zone on the chart.
This kind of sustained action near the top of a range, rather than a sharp rejection, usually points to accumulation rather than distribution.
Sellers have had chances to push price down hard here and have not managed to do it.
The weekly RSI is currently reading 65.17, still comfortably below overbought territory, which leaves room for price to extend higher without immediately running into momentum warnings.
Hyperliquid Price Prediction 2029: Targets If Breakout Confirms
If HYPE manages to break out from this consolidation near the all-time high, the Fib extension levels above the current price become the relevant targets for the next leg.
Based on the chart structure, the first target sits just above the current all-time high, with the next levels stacking up higher from there as each one gets cleared with confirmation, a key part of this HYPE price forecast for anyone tracking whether HYPE can reach $200.
Below current price, there is one level that matters more than any other on this chart.
If the market pulls back and trades down into that zone, it would likely trigger aggressive long-term buying, since that area has acted as a strong demand zone in the past and represents one of the most reliable support levels on the entire chart.
Hyperliquid Price Prediction 2029: Targets for the Next Cycle
Timeframe | Scenario | Min Target | Max Target | Key Trigger |
Late 2026 | Range Defense | $55 | $75 | All-time high zone holds |
2027 | Breakout Attempt | $75 | $120 | Confirmed close above ATH |
2028 | Extension Phase | $120 | $160 | Fib target progression confirmed |
2029 | Cycle Peak Zone | $160 | $220 | Full extension playout, strong demand returns |
These price projections are not guaranteed and are based on technical analysis, historical trends, and market assumptions. Actual Hyperliquid prices may vary significantly.
Risk and Reward: The Honest Version
Factor | Bull Case | Bear Case |
All Time High Retest | Breaks out, confirms fresh price discovery | Rejects again, range extends longer |
Key Support Line | Holds, sparks aggressive long-term buying | Breaks down, structure weakens |
RSI Momentum | Stays healthy, supports continuation | Rolls over, signals fading strength |
Buyback Demand | Steady platform revenue keeps pressure up | Trading activity slows, demand cools |
Invalidation Level
This entire setup depends on the key support line below the current price holding firm.
A weekly close beneath that level would invalidate the bullish structure, and in that case HYPE would likely need to build a new base at lower levels before any fresh attempt at the Fibonacci extension targets becomes realistic.
Hyperliquid Price Prediction 2029: Expert View
Analysts watching the weekly chart point out that HYPE sustaining this close to its all-time high, without a sharp rejection, is a constructive sign heading into the next stretch.
A confirmed breakout above the current highs, combined with continued buyback pressure from platform revenue, would be the strongest signal that HYPE is ready for its next major leg in this ongoing Hyperliquid forecast.
Until that breakout confirms, the setup remains a range-bound story, with the key support line below acting as the level that would flip sentiment sharply bullish if tested and held.
Conclusion
HYPE's chart comes down to two levels right now, the all-time high above and the key support line below.
As long as the price keeps holding near the highs without breaking that lower support, the structure stays healthy.
A breakout above the all-time high opens the door to the Fib extension targets, while a pullback into that lower zone could actually set up the more aggressive long-term buying opportunity heading toward 2029.
Disclaimer: This article is written for educational and informational purposes only. Nothing here is financial advice. Cryptocurrency markets are volatile and unpredictable. All analysis is based on publicly visible chart data and historical patterns. Always do your own research before making any financial decisions.
0
0

 Manage all your crypto, NFT and DeFi from one place
Securely connect the portfolio you’re using to start.


0
0

0
0