Ethereum price stuck at $1,774: range of only $44, breakout is near

0
0

As of 16 June 2026, the price of Ethereum is at $1,774, in an apparently calm compression that hides unresolved bearish pressure on the daily. ETH is not on pause: it is in a technical limbo where every bounce risks looking like a recovery that is not there yet.
Key points
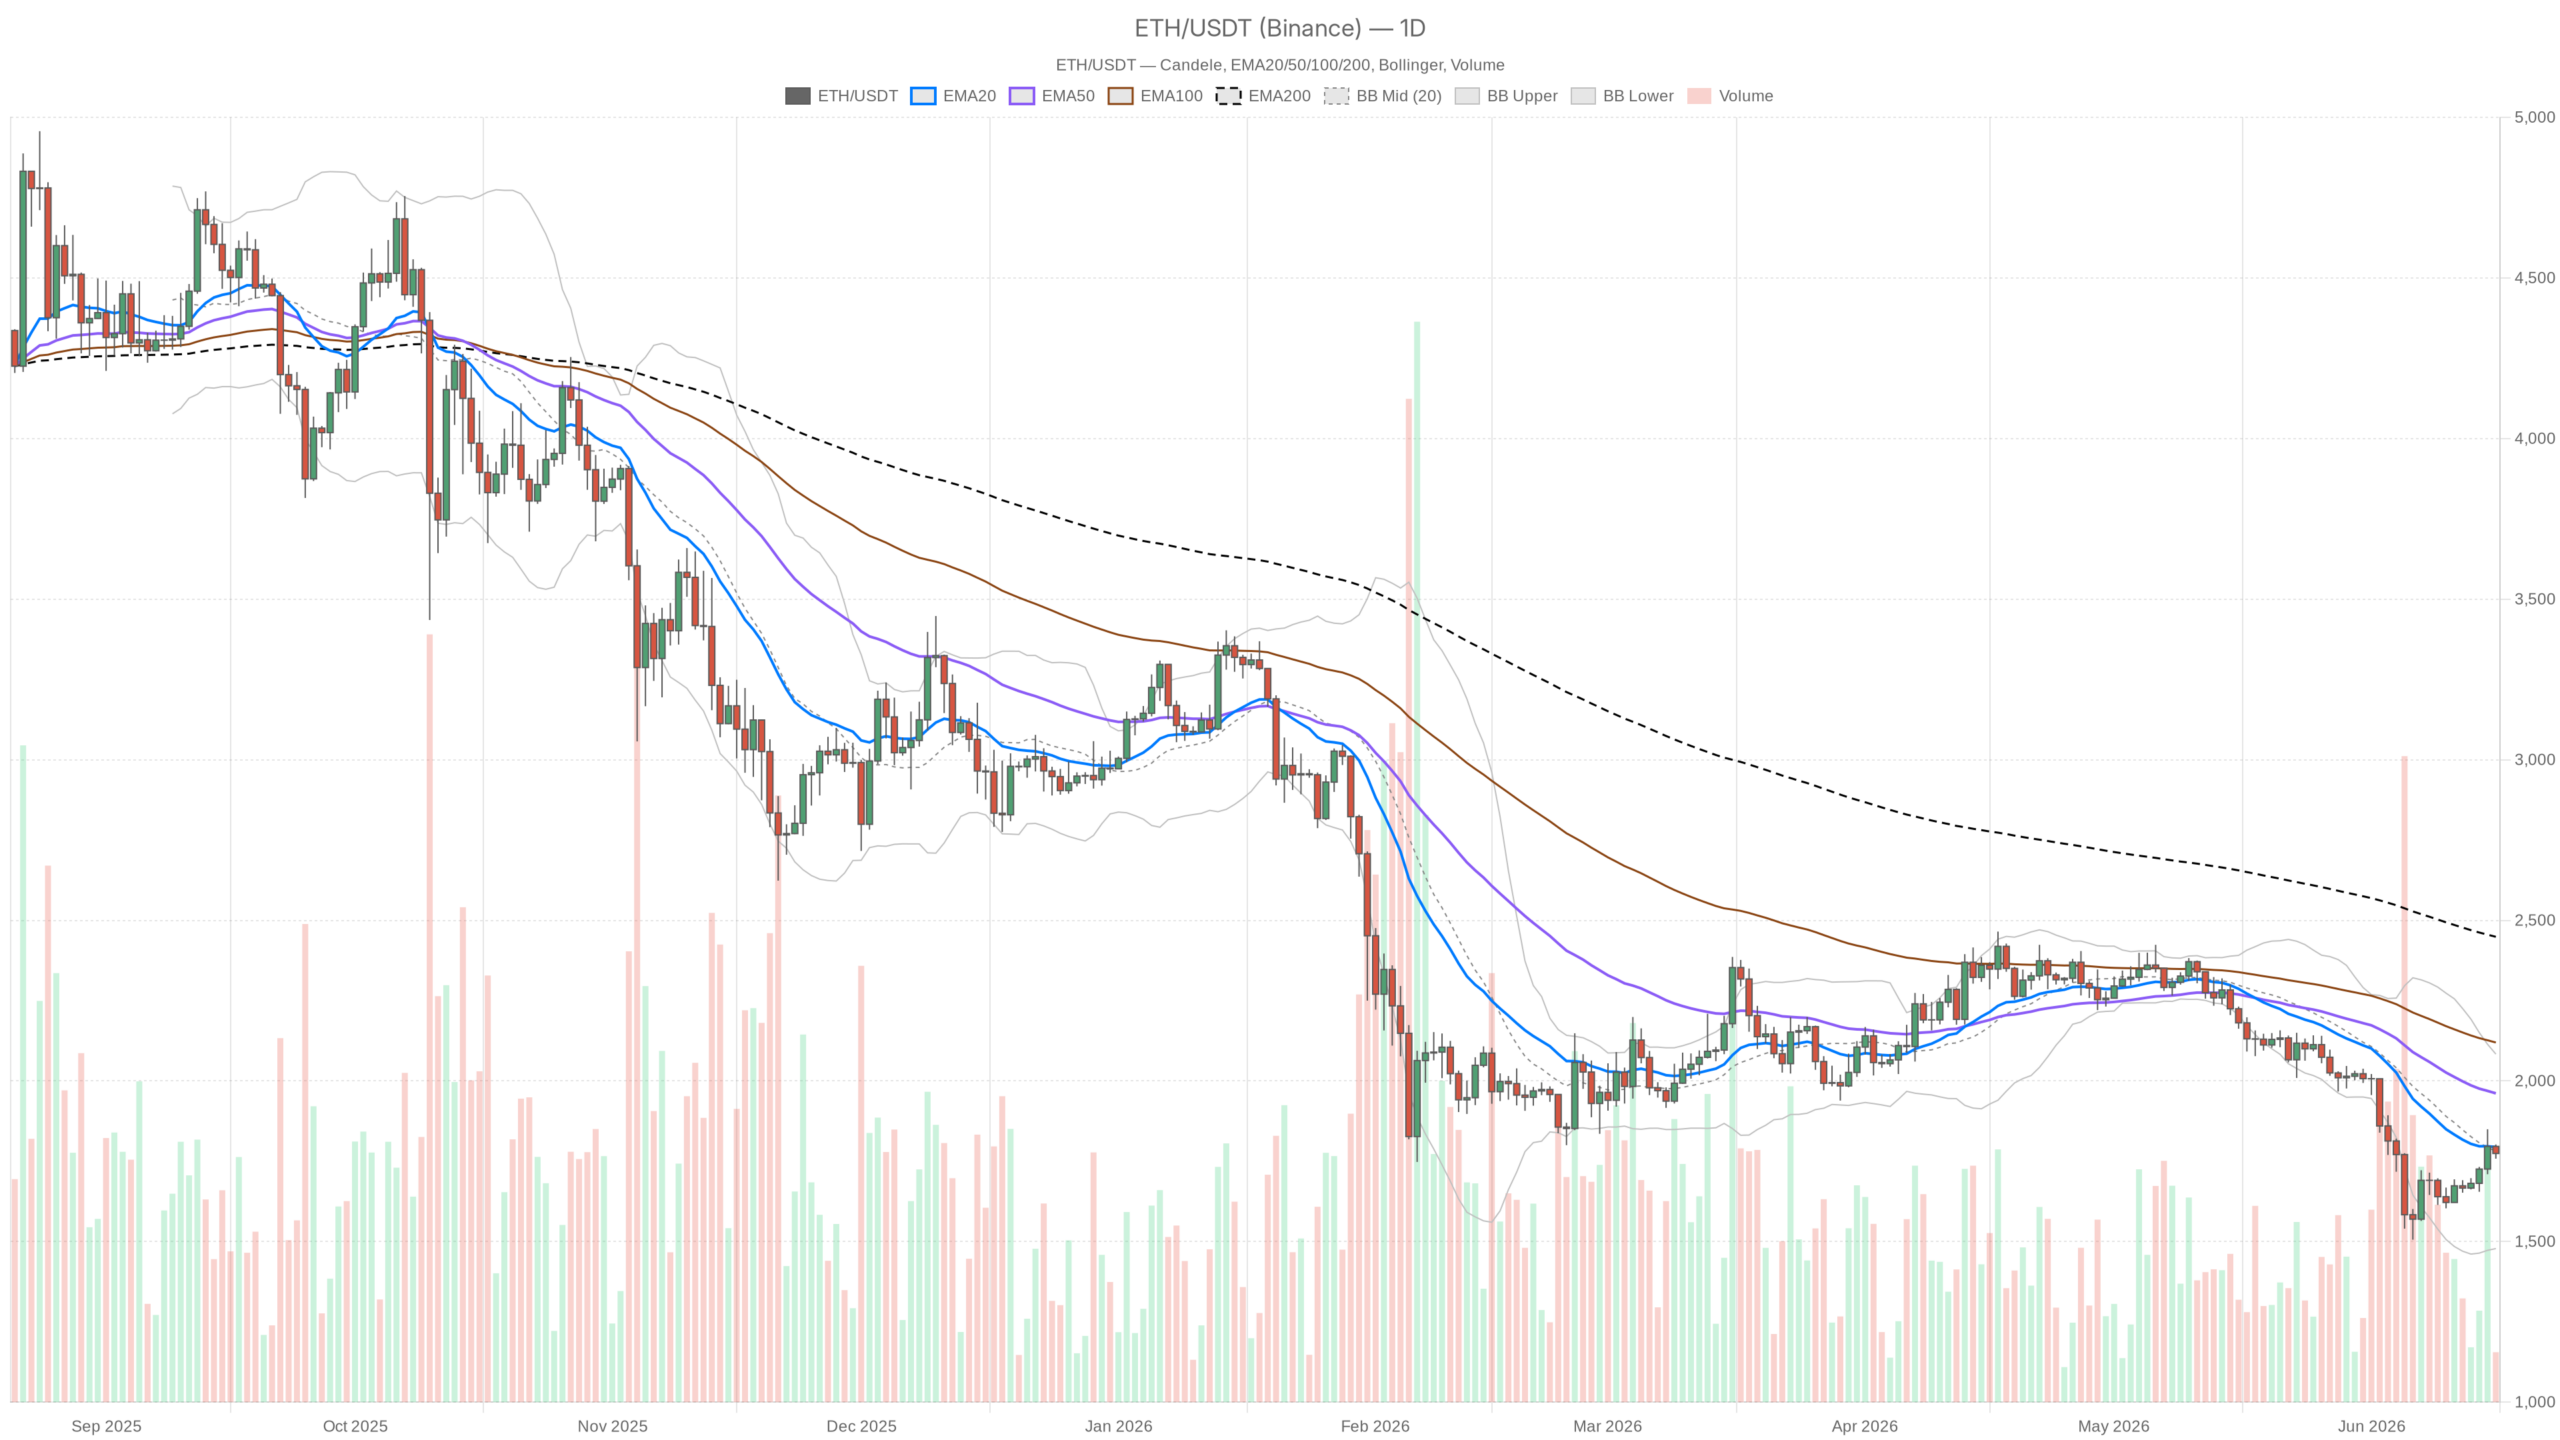
- ETH at $1,774, below the EMA20, EMA50 and EMA200 on the daily: structural bearish trend confirmed.
- Daily RSI at 43.48: insufficient momentum, neither oversold nor recovering.
- Fear & Greed Index at 23 (Extreme Fear) and Bitcoin dominance at 56.5%: capital remains defensive.
- Key resistance at $1,798, support at $1,754: a compressed range of just $44.
- DeFi fees sharply higher: +168% on Uniswap V3 and +192% on Fluid DEX over the last 24 hours.
The underlying structure is clear
On the daily the picture is unequivocal: Ethereum is trading below all the significant moving averages. The EMA20 is at 1,794, the EMA50 at 1,961 and the EMA200 at $2,448. The updated ETH price is below all three, and this is not a detail — it is the signature of a bearish trend that has lasted for months. Every recovery attempt has hit these levels like a wall. As long as ETH fails to move back steadily above at least the EMA20, talking about a reversal is premature.
The daily RSI at 43.48 confirms this reading: we are not in deep oversold territory, but we are in that grey area where momentum fails to generate thrust. There is no capitulation, but there is also no real buying energy. Today’s Ethereum price reflects exactly this: a market that is not collapsing but cannot rise.
The daily MACD is still negative — line at -96.36 with signal at -119.04 — but the positive histogram at +22.68 is the only technical glimmer on the longer timeframe. It suggests that the bearish pressure is at least easing, not that it has been exhausted. It is an internal divergence within the MACD that must be monitored, not celebrated.
Bollinger Bands and compressed volatility
On the daily, the Bollinger Bands show an upper band at $2,083 and a lower band at $1,478, with the real-time ETH price moving in the lower half of the channel. The ATR at $95 indicates that average daily volatility is significant: moves of $80–100 in a single session would not be unusual, which makes risk management an absolute priority in this context.
On the 15-minute chart the bands have tightened considerably — upper at 1,781, lower at 1,757 — indicating short-term compression. Historically, these contraction periods precede sharp directional moves. The question is: in which direction?
The conflict between timeframes
This is the most delicate point. On the daily, the regime is classified as bearish. On the hourly and 15-minute charts we are in neutral territory. This divergence between timeframes is the real operational risk at the moment: intraday traders may find buy signals that seem valid, but that exist simply because the market is breathing within a broader bearish trend.
On the 1H, the EMA50 at 1,750 and the EMA200 at 1,700 are both below the current price — a fact that in isolation would seem positive. However, the hourly MACD has already turned negative with a histogram at -8.26, indicating that short-term momentum has lost traction. The hourly RSI at 50.9 is exactly neutral: it says nothing definitive.
The levels that really matter
The daily pivot point is at 1,778, with resistance R1 at $1,798 and support S1 at 1,754. Today’s Ethereum price is moving practically on the pivot, in a $44 range between support and first resistance. A strong break of 1,798 would open the way towards 1,850 and then towards the critical EMA20 zone at 1,794–1,800. Losing 1,754 instead would expose ETH towards 1,700–1,720, where the next cluster of technical supports is concentrated.
On the 15-minute chart, the pivots are compressed between 1,772 and 1,775, confirming the micro-stalemate. The market is waiting for a catalyst.
The macro context does not help
The Fear & Greed Index is at 23 — Extreme Fear — and this data point alone says a lot about the current sentiment. This is not a market ready to buy positive news with conviction. Bitcoin dominance at 56.5% according to CoinGecko data confirms that capital continues to gravitate towards the most liquid and defensive asset in the sector, leaving ETH and altcoins in a position of relative weakness. The total crypto market capitalization is around $2.352 trillion, up 1.3% over the last 24 hours — a modest rebound that does not change the structural picture.
On the DeFi front, DefiLlama data show a spike in fees on Uniswap V3 and Fluid DEX over the last 24 hours, with daily increases of 168% and 192% respectively. These are signs of speculative on-chain activity that could bring volume to the Ethereum network, but which so far have not translated into buying pressure on the updated ETH price.
Bullish scenario
For this scenario to play out, ETH needs to close a daily candle above 1,798 with expanding volume, opening the way towards the EMA20 at 1,794 and then towards the 1,850–1,900 area. A recovery of that band would change the tone of the market and could attract buying from short positions closing out. The scenario is invalidated if the price falls back below 1,750 without reacting.
Bearish scenario
Losing 1,754 on a daily close would open room towards 1,700 and potentially towards the 1,620–1,650 band, which represents a deeper area of structural support. In a context of extreme Fear and high BTC dominance, a downside break could accelerate quickly. The scenario is only invalidated with a clear close above 1,820.
How to read this moment
The current Ethereum rate is that of an asset in waiting — technically compressed, structurally weak, emotionally heavy. Those looking for confirmation for a long must wait for signals on the daily: no aggressive entries in a market where the underlying trend is still against you. Those already in short positions must pay attention to the 15-minute compression and the improving daily MACD histogram — false bearish signals in these zones are as common as bullish ones. The main risk right now is not taking the wrong direction: it is confusing the apparent calm of the real-time ETH price with a stability that the market has not yet earned.
FAQ
Why can’t Ethereum rise despite growing DeFi activity?
Because the structural trend on the daily remains bearish. ETH is below all the main moving averages and market sentiment is in Extreme Fear. The increase in on-chain activity has not yet translated into buying pressure on the price.
What levels should be monitored for a bullish reversal?
The key resistance is at $1,798. A daily close above this level with expanding volume could open the way towards 1,850–1,900. Recovering the EMA20 at $1,794 is also crucial.
What makes this moment particularly risky for traders?
The conflict between timeframes: on the daily the regime is bearish, while on the intraday the signals are neutral. This can generate false buy signals. In addition, the compression of the Bollinger Bands on the 15-minute chart foreshadows an imminent directional move, but the direction is not yet clear.
{“@context”:”https://schema.org”,”@type”:”FAQPage”,”mainEntity”:[{“@type”:”Question”,”name”:”Why can’t Ethereum rise despite growing DeFi activity?”,”acceptedAnswer”:{“@type”:”Answer”,”text”:”Because the structural trend on the daily remains bearish. ETH is below all the main moving averages and market sentiment is in Extreme Fear. The increase in on-chain activity has not yet translated into buying pressure on the price.”}},{“@type”:”Question”,”name”:”What levels should be monitored for a bullish reversal?”,”acceptedAnswer”:{“@type”:”Answer”,”text”:”The key resistance is at $1,798. A daily close above this level with expanding volume could open the way towards 1,850–1,900. Recovering the EMA20 at $1,794 is also crucial.”}},{“@type”:”Question”,”name”:”What makes this moment particularly risky for traders?”,”acceptedAnswer”:{“@type”:”Answer”,”text”:”The conflict between timeframes: on the daily the regime is bearish, while on the intraday the signals are neutral. This can generate false buy signals. In addition, the compression of the Bollinger Bands on the 15-minute chart foreshadows an imminent directional move, but the direction is not yet clear.”}}]}
Disclaimer: This article is for informational purposes only and does not constitute financial advice, investment recommendation or a solicitation to buy or sell financial instruments or cryptocurrencies. The analyses do not guarantee future results. Investments in crypto-assets and financial markets involve a high risk of capital loss. Always do your own research (DYOR) and consult a qualified financial advisor before making any decision.
Content created with the assistance of artificial intelligence and human editorial review.
0
0

 Manage all your crypto, NFT and DeFi from one place
Securely connect the portfolio you’re using to start.


0
0

0
0