Will the US, Hong Kong, and Australia Bitcoin ETFs Spark 8-Year Gold-Like Bull Rally?
17d ago•

bullish:
0
bearish:
0
Share

Since the US Securities and Exchange Commission (SEC) approved spot Bitcoin exchange-traded funds (ETFs) on January 11, 2024, the crypto market has experienced a significant recovery. This culminated on March 14, 2024, when Bitcoin (BTC) reached a new all-time high (ATH) of $73,737.
This uptrend isn’t confined to the US alone. Hong Kong just launched its spot Bitcoin and Ethereum ETFs, while Australia is preparing to launch its own versions of spot Bitcoin ETFs.
The global enthusiasm mirrors the community’s optimistic view of Bitcoin as not just a currency but a potential digital counterpart to gold.
Can Bitcoin ETFs Help Sustain 8-Year Bull Rally?
The narrative of Bitcoin as a store of value and an inflation hedge brings it close to gold’s market stance, with comparisons now extending to their respective ETFs. Historical precedents offer a compelling storyline.
The gold ETF launch in 2004 triggered a nearly 8-year bull market. The first gold ETF, SDPR Gold Shares, was listed on the New York Stock Exchange (NYSE) on November 1, 2004, when gold was priced at $450.80 per ounce. It then consistently grew, reaching $1,825 on August 1, 2011. In 2024, gold has successfully achieved a price of $2,392 on April 19.
However, according to a post by crypto YouTuber Altcoin Daily on X (formerly Twitter), the BlackRock Bitcoin ETF achieved in 70 days what took the gold ETF over 800 days in assets under management (AUM). He highlighted the unprecedented demand for Bitcoin compared to gold’s initial days in the ETF sphere.
“This is just the beginning…” Altcoin Daily noted.
Read more: Crypto ETN vs. Crypto ETF: What Is the Difference?
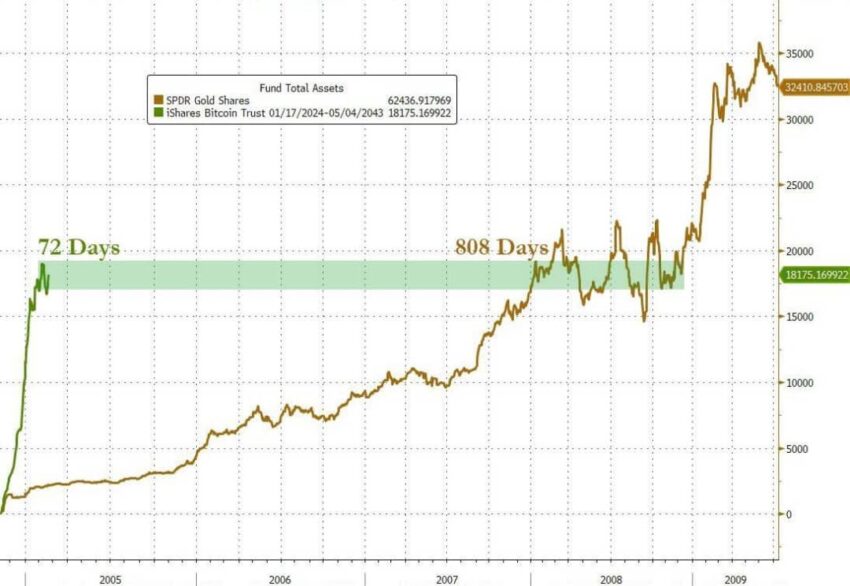 GLD and IBIT AUM Comparison. Source: X/AltcoinDailyio
Supporting this perspective, Bitcoin analyst Willy Woo pointed out the current fiscal dynamics.
“Now that the monetary inflation rate of Bitcoin has dropped below Gold, it will be interesting to see if its market cap will exceed gold according to the stock to flow [S2F] thesis,” Woo commented.
He anticipates that Bitcoin will align with its S2F valuation but with a lag of 5-10 years. Woo cites the slower pace of global financial systems in adopting such innovations.
Bitcoin’s technological architecture might give it another edge over gold. Events like the quadrennial halving are designed to reduce the number of new Bitcoins entering the market, theoretically increasing its value over time.
Indeed, historically speaking, post-halving periods have led to substantial price increases. The 2012 halving preceded a jump from $12 to over $1,000 by late 2013. Similarly, the 2016 halving saw prices soar from around $650 to nearly $20,000 by December 2017. Finally, the 2020 halving pushed prices from around $8,000 to $69,000 by November 2021.
These patterns suggest a bullish outlook, albeit with the caveat that price surges are typically long-term rather than immediate. Renowned analyst PlanB reaffirmed this. They predicted significant future growth despite short-term fluctuations.
PlanB noted a bullish outlook that aligns with historical data and market analysis despite current market variances.
“BTC > $100,000 in 2024. BTC top > $300,000 in 2025,” PlanB stated.
Price Retreats Despite ETF Success
Yet, regardless of speculative optimism and historical trends, today’s market movement paints a different picture. At the time of writing, Bitcoin trades at $62,035, a slight decrease of 0.47% over the last 24 hours.
Similarly, spot gold is also experiencing modest movement, trading at $2,311. This number represents a decrease of approximately 1.02% from yesterday’s price.
Furthermore, data from SoSo Value indicates that US spot Bitcoin ETFs have recorded daily outflows of $51.53 million as of April 29, 2024. This marks the fourth consecutive day of negative flows. Even BlackRock’s iShares Bitcoin Trust (IBIT), previously a top performer, recorded no new inflows during the period.
Read more: Bitcoin Price Prediction 2024/2025/2030
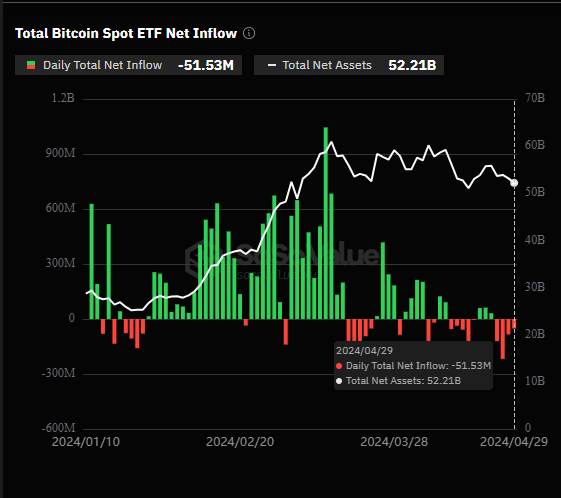 Total US Spot Bitcoin ETFs Net Daily Flow. Source: SoSo Value
These indicators suggest a cautious approach. While the enthusiasm around Bitcoin ETFs is palpable, and comparisons to gold’s ETF-driven rally are tempting, the reality on the trading floors tells a story of volatility and speculative uncertainty.
With its complex interplay of technology, economics, and global regulations, Bitcoin presents a unique investment perspective that may or may not parallel the historical ascent of gold. Investors and spectators alike would do well to observe these developments closely, considering both the potential and the pitfalls of this digital asset class.
17d ago•
bullish:
0
bearish:
0
Share


 Manage all your crypto, NFT and DeFi from one place
Securely connect the portfolio you’re using to start.

bullish:
0
bearish:
0


bullish:
0
bearish:
0