Tellor (TRB) Price Prediction – Is It Setting Up For Another Mammoth Rally?
4M ago•

bullish:
0
bearish:
0
Share

NEW DELHI (CoinChapter.com) — Tellor (TRB) started a fresh increase after finding strong bids above $110. It shows positive signs on the daily chart and might rally toward $200.
Tellor TRB Price Prediction is Bullish
Earlier this month, Tellor’s price saw nasty moves. After a massive rally, TRB formed a major top at $626 and started a substantial decline. It trimmed most of its gains and settled below the $200 pivot level.
Finally, the bulls took a strong stand above the $110 level. It seems like the price formed a support base above the $100-$110 zone and recently started a fresh increase, outperforming Bitcoin and Solana. There was a clear move above the $125 and $130 resistance levels.
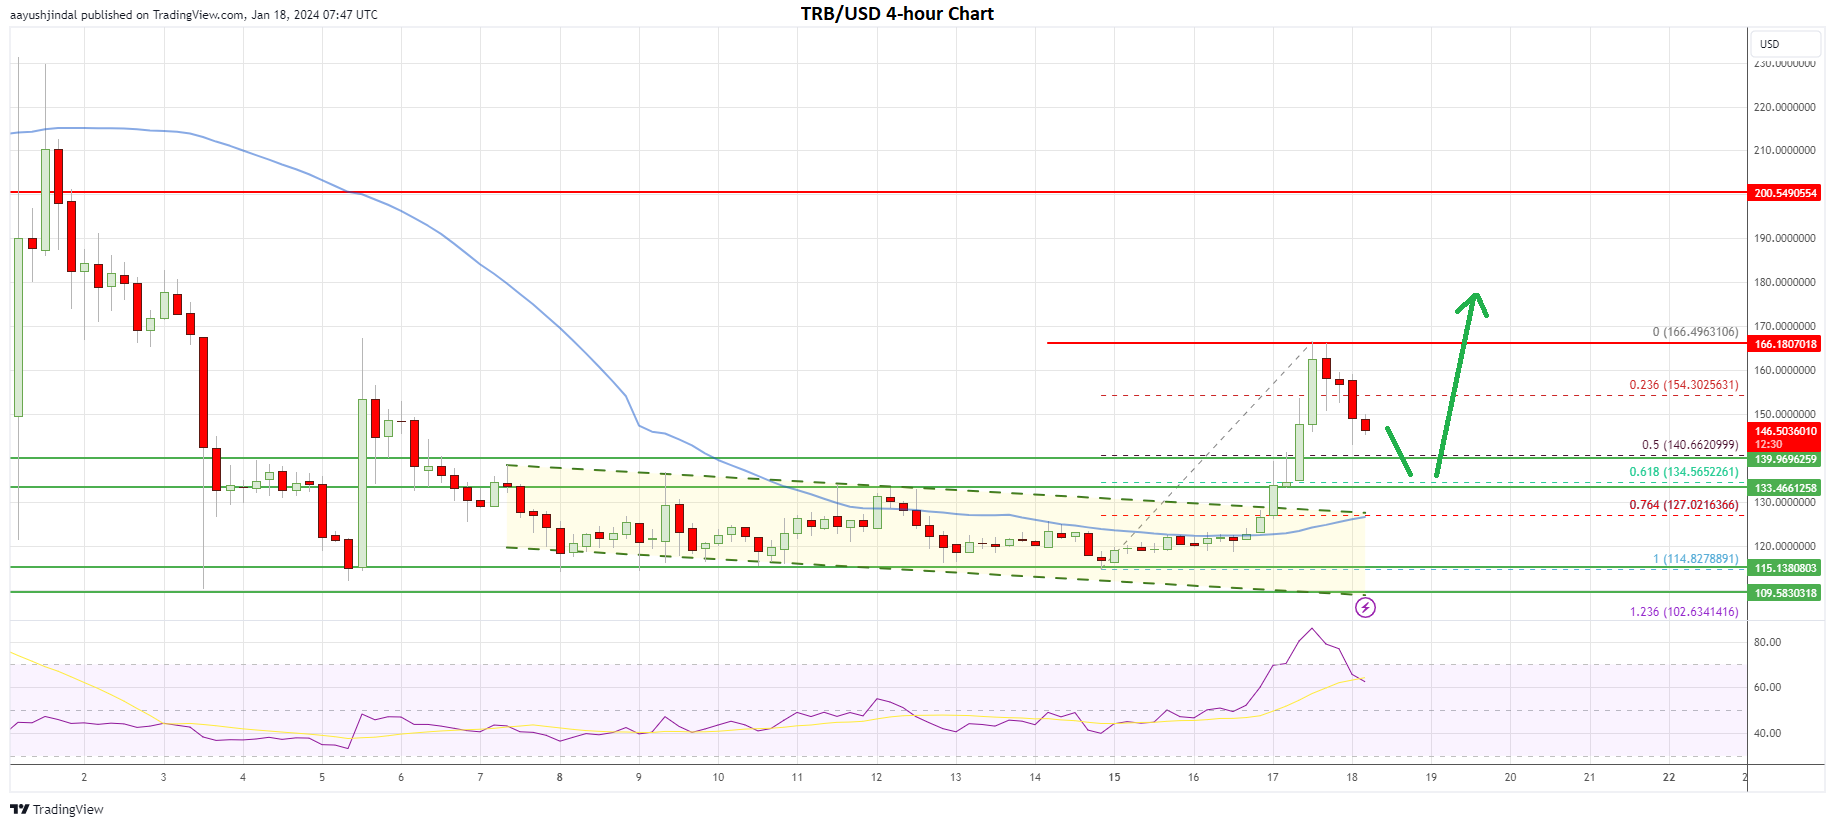


More importantly, TRB’s price broke a declining channel with resistance at $130 on the 4-hour chart. It rallied over 25% and tested the $165 level. The price is now correcting gains below the $150 level. On the downside, the bulls might appear near the 50% Fib retracement level of the upward move from the $114 swing low to the $166 high.
The first major support is now forming near the $135 level. It is close to the 61.8% Fib retracement level of the upward move from the $114 swing low to the $166 high.
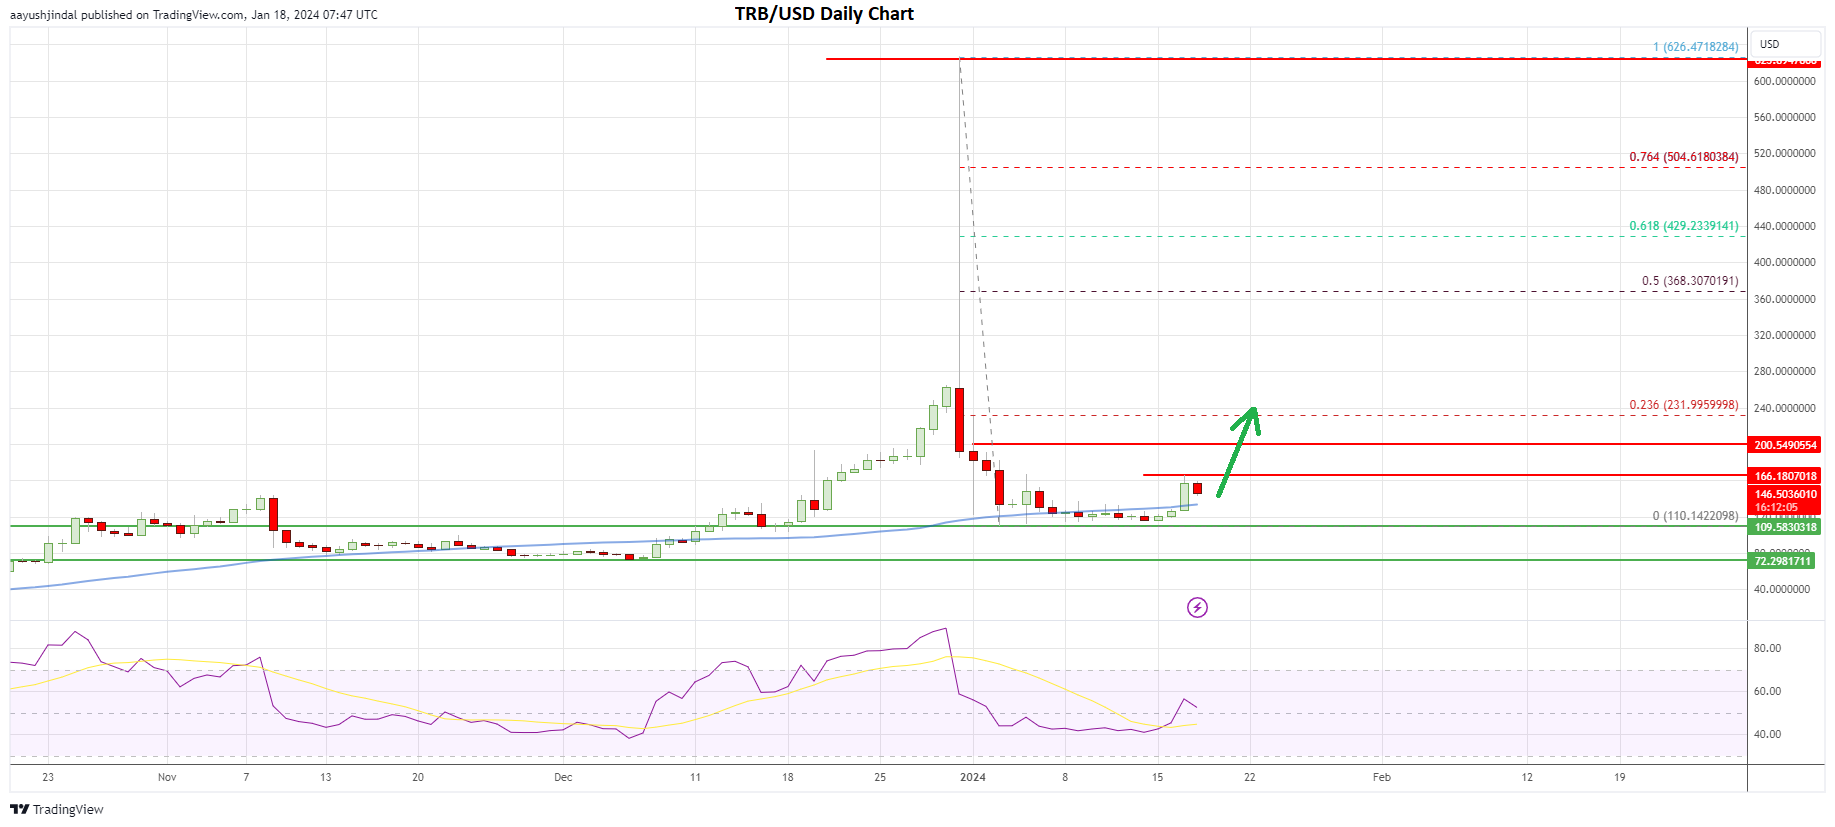
If Tellor’s price reaches the $135 support, there could be a strong bullish reaction. Looking at the daily chart, TRB could be setting up for another mammoth rally. It now trades comfortably above the 50-day simple moving average (blue).
Besides, the current daily candle indicates a rejection from the $110 support zone. Therefore, dips might be attractive in the near term unless there is a close below the 50-day simple moving average (blue) at $130.
TRB Bulls Aim For $200 Minimum?
On the upside, TRB could face resistance near the $155 level. The first major resistance is near the $165 level. A clear move above the $165 level could send it toward $200. Any more gains may open the doors for a surge toward $350 or even $420.
Overall, Tellor’s price shows positive signs on the daily chart and might rise toward the $200 resistance. If there is a downside correction, $130 and $135 hold the key to a fresh increase in TRB.
The post Tellor (TRB) Price Prediction – Is It Setting Up For Another Mammoth Rally? appeared first on CoinChapter.
4M ago•
bullish:
0
bearish:
0
Share


 Manage all your crypto, NFT and DeFi from one place
Securely connect the portfolio you’re using to start.

bullish:
0
bearish:
0

bullish:
0
bearish:
0


bullish:
0
bearish:
0