SOL USD Dips Below $140: How Long And How Much Deeper?
0
0
SOL USD is down 25% in the past 7 days and is finally giving us a deadcat bounce. This all could be a setup by large players to buy the newly released ETFs. Maybe. Either way, the price hit a new ATH of $295 this year, and that is a 35x from the $8 bottom in 2022. No need to be mad if people are taking profits here.
https://twitter.com/solana/status/1990800014034219188?s=20
It is certainly a huge win to have the ETFs trading now. Since its launch, the total net assets (Spot SOL ETF) held now are just over $500 million. Fidelity’s joining the party could unlock new capital inflows, which could seal the nearly two-year-long range.
DISCOVER: 9+ Best High-Risk, High-Reward Crypto to Buy in 2025
How Is SOL Performing Against Bitcoin?

(Source – Tradingview, SOLBTC)
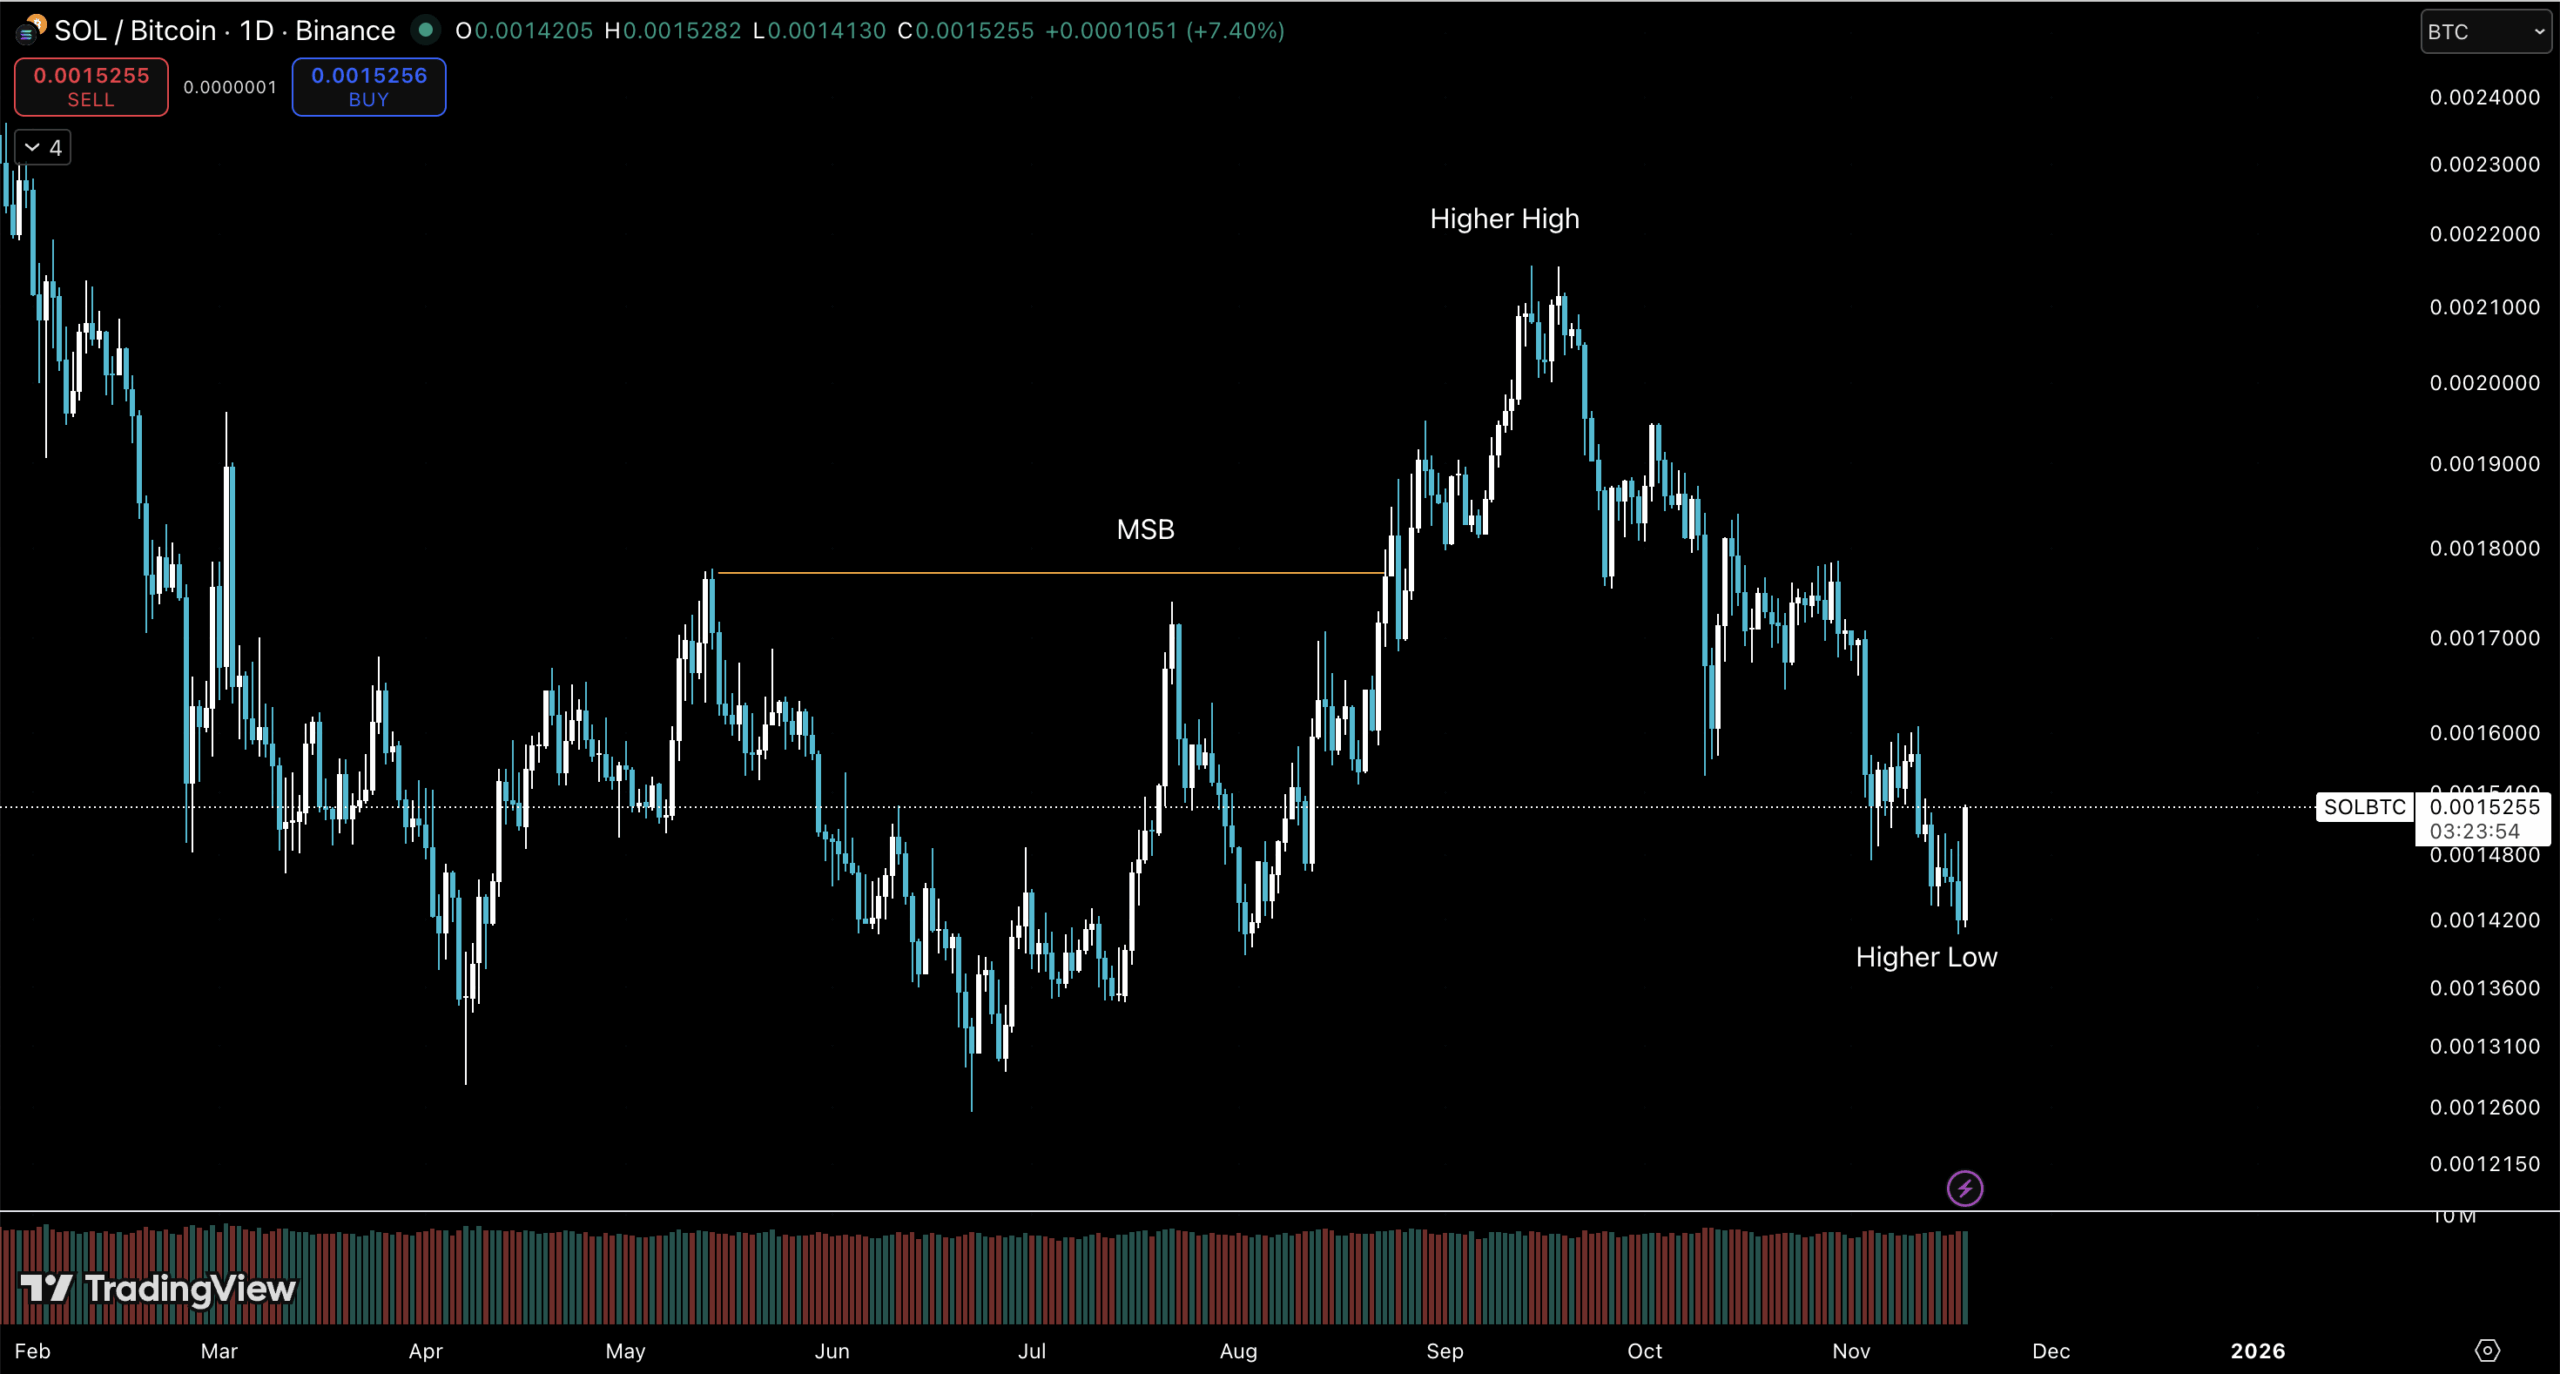
When it comes to altcoins making new highs, their performance against Bitcoin matters significantly. During alt season, all the coins that run are outperforming BTC. On this 1D SOLBTC chart, we have a break in market structure, a Higher High, and hopefully a Higher Low formed at this point. The daily candle closing as Bullish Engulfing will be a huge win.
SOL USD Key Levels To Watch Next

(Source – Tradingview, SOLUSD)
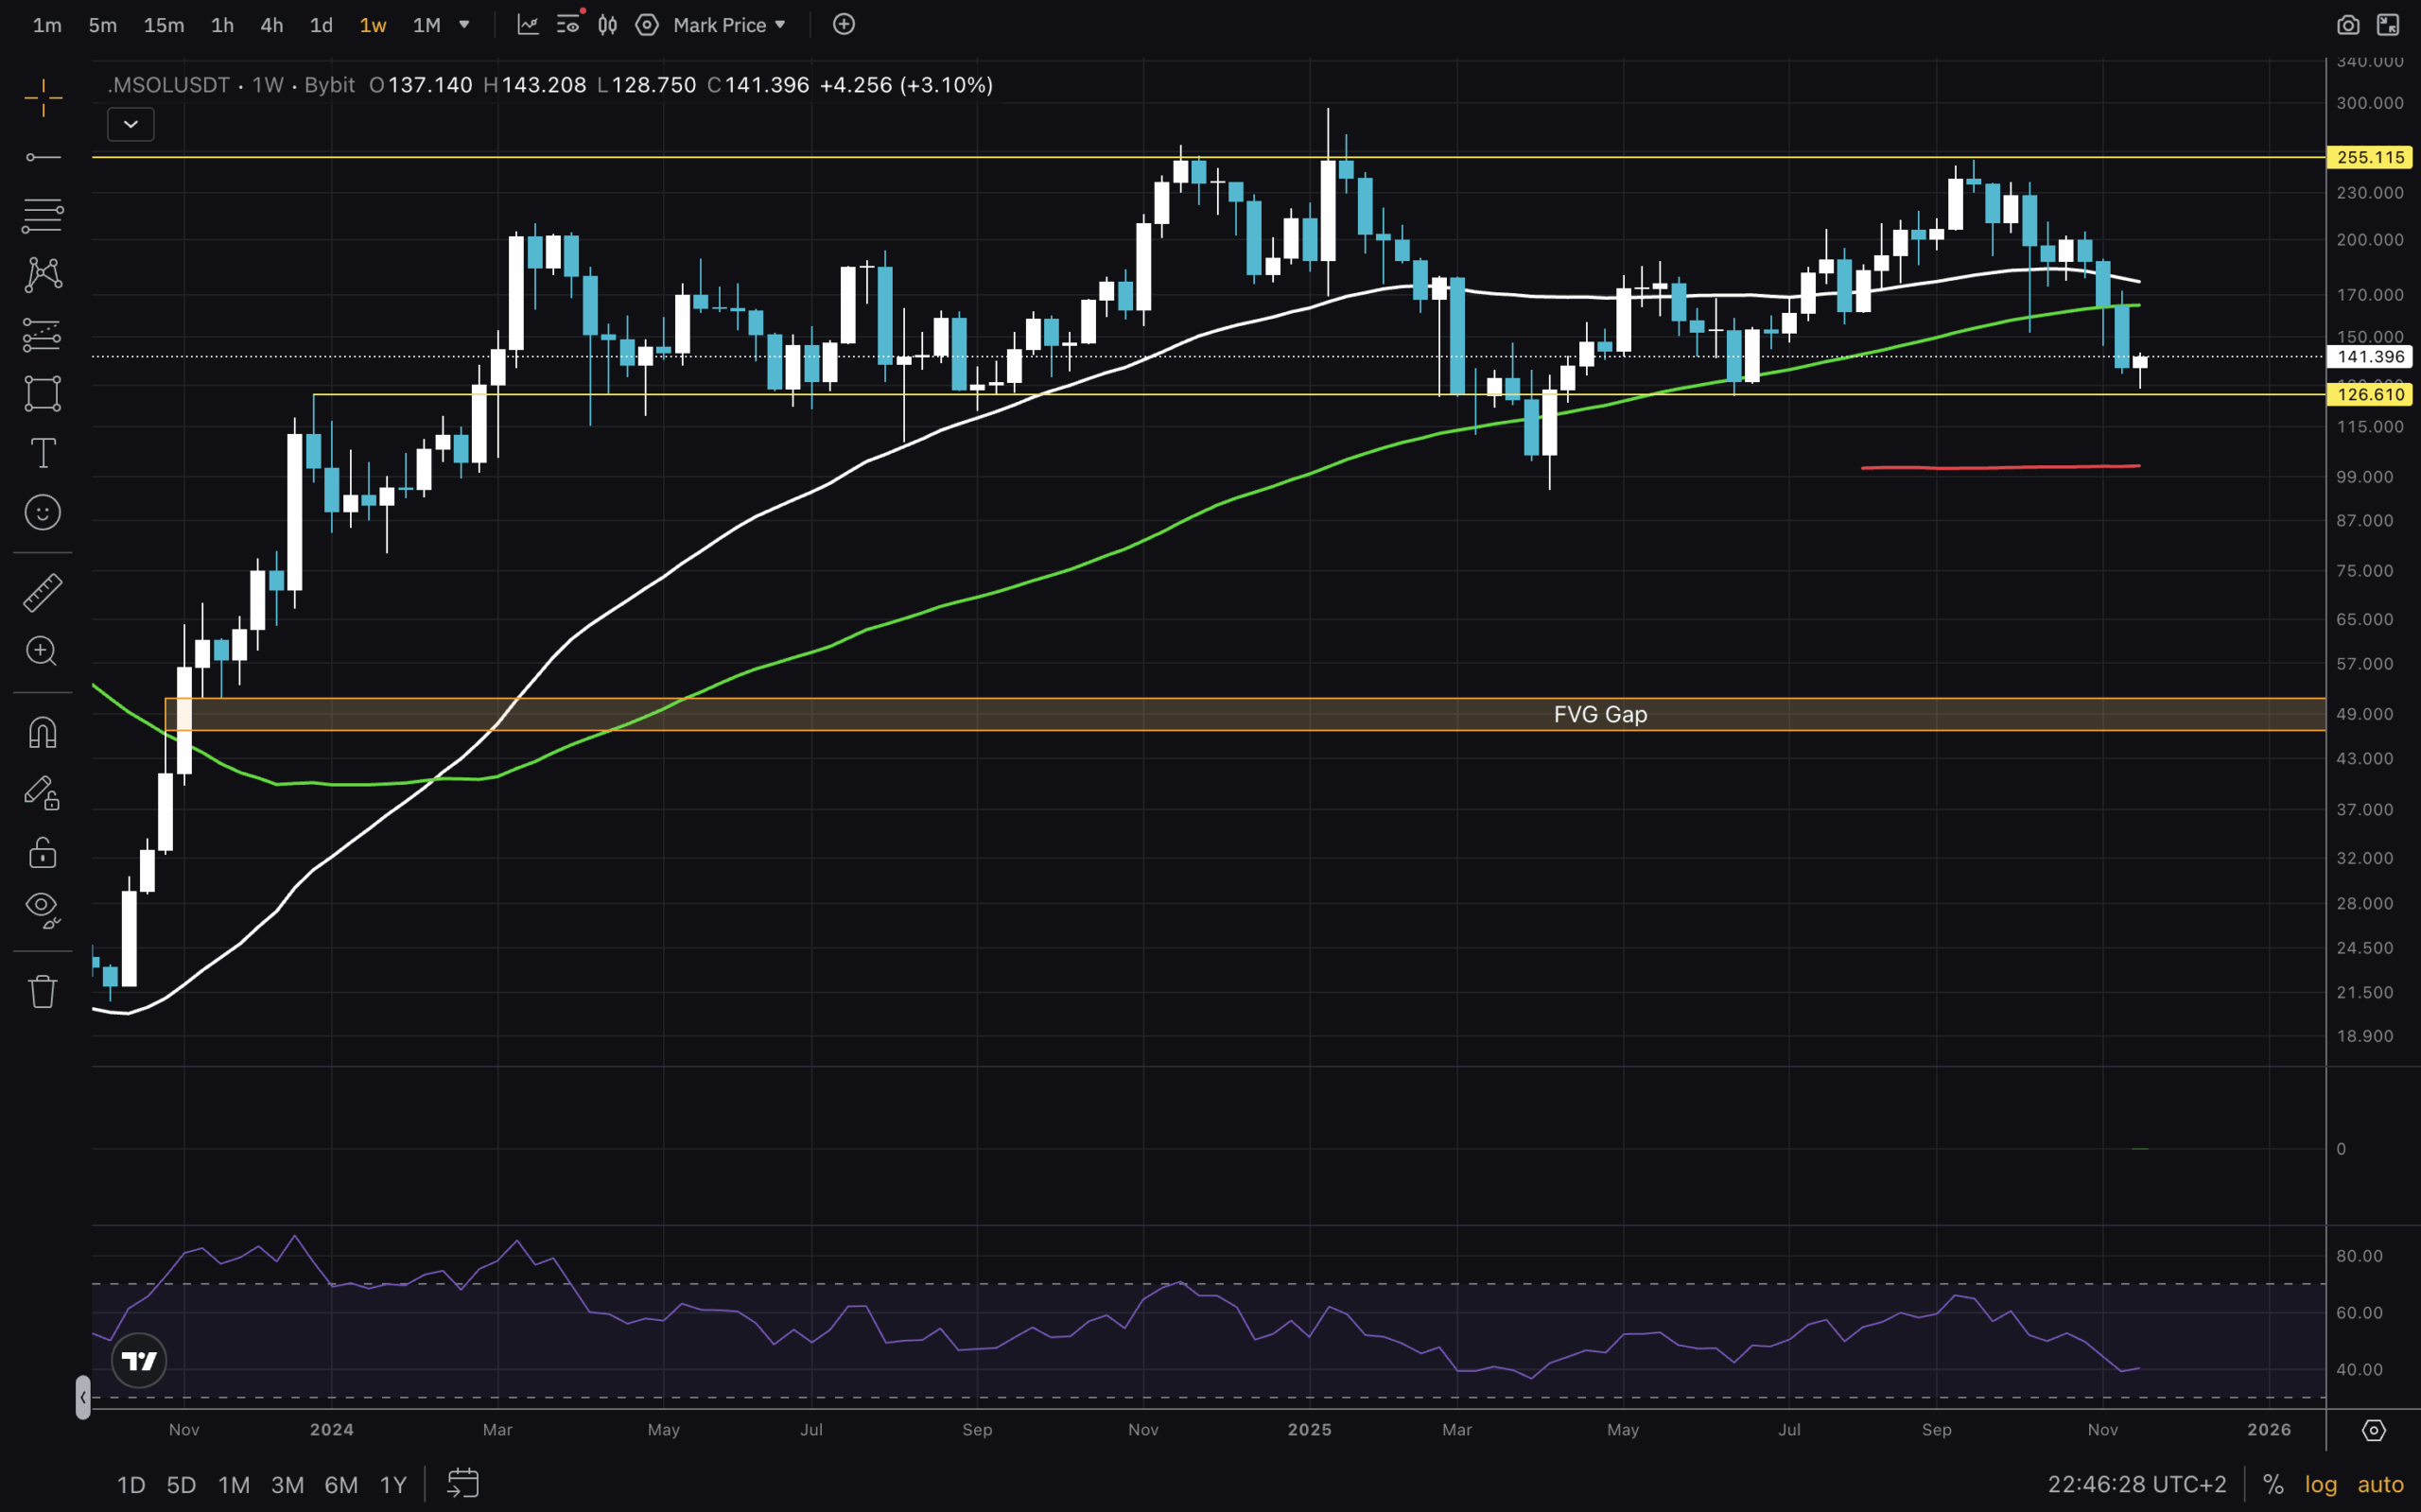
Let us look at the SOL USD charts now. Starting with the Weekly timeframe, we can see that since early 2024, we have been in the $126 – $255 range. The big question is, where will the price break out from – bottom or top? It is important to notice that we are below both MA50 and MA100 at this point, leaving only MA200 as a potential support. It does align with the April 2025 low, which is a good confluence to keep in mind if we see lower numbers.
RSI has been fairly chill for more than a year as well. There is a weekly FVG between $46 and $51. Not shown on this chart are two Monthly FVGs as well. The higher one is between $68-$78, and the lower one is between $38-$58. This is the lowest possibility I personally see SOL dropping to.
DISCOVER: 20+ Next Crypto to Explode in 2025

(Source – Tradingview, SOLUSD)
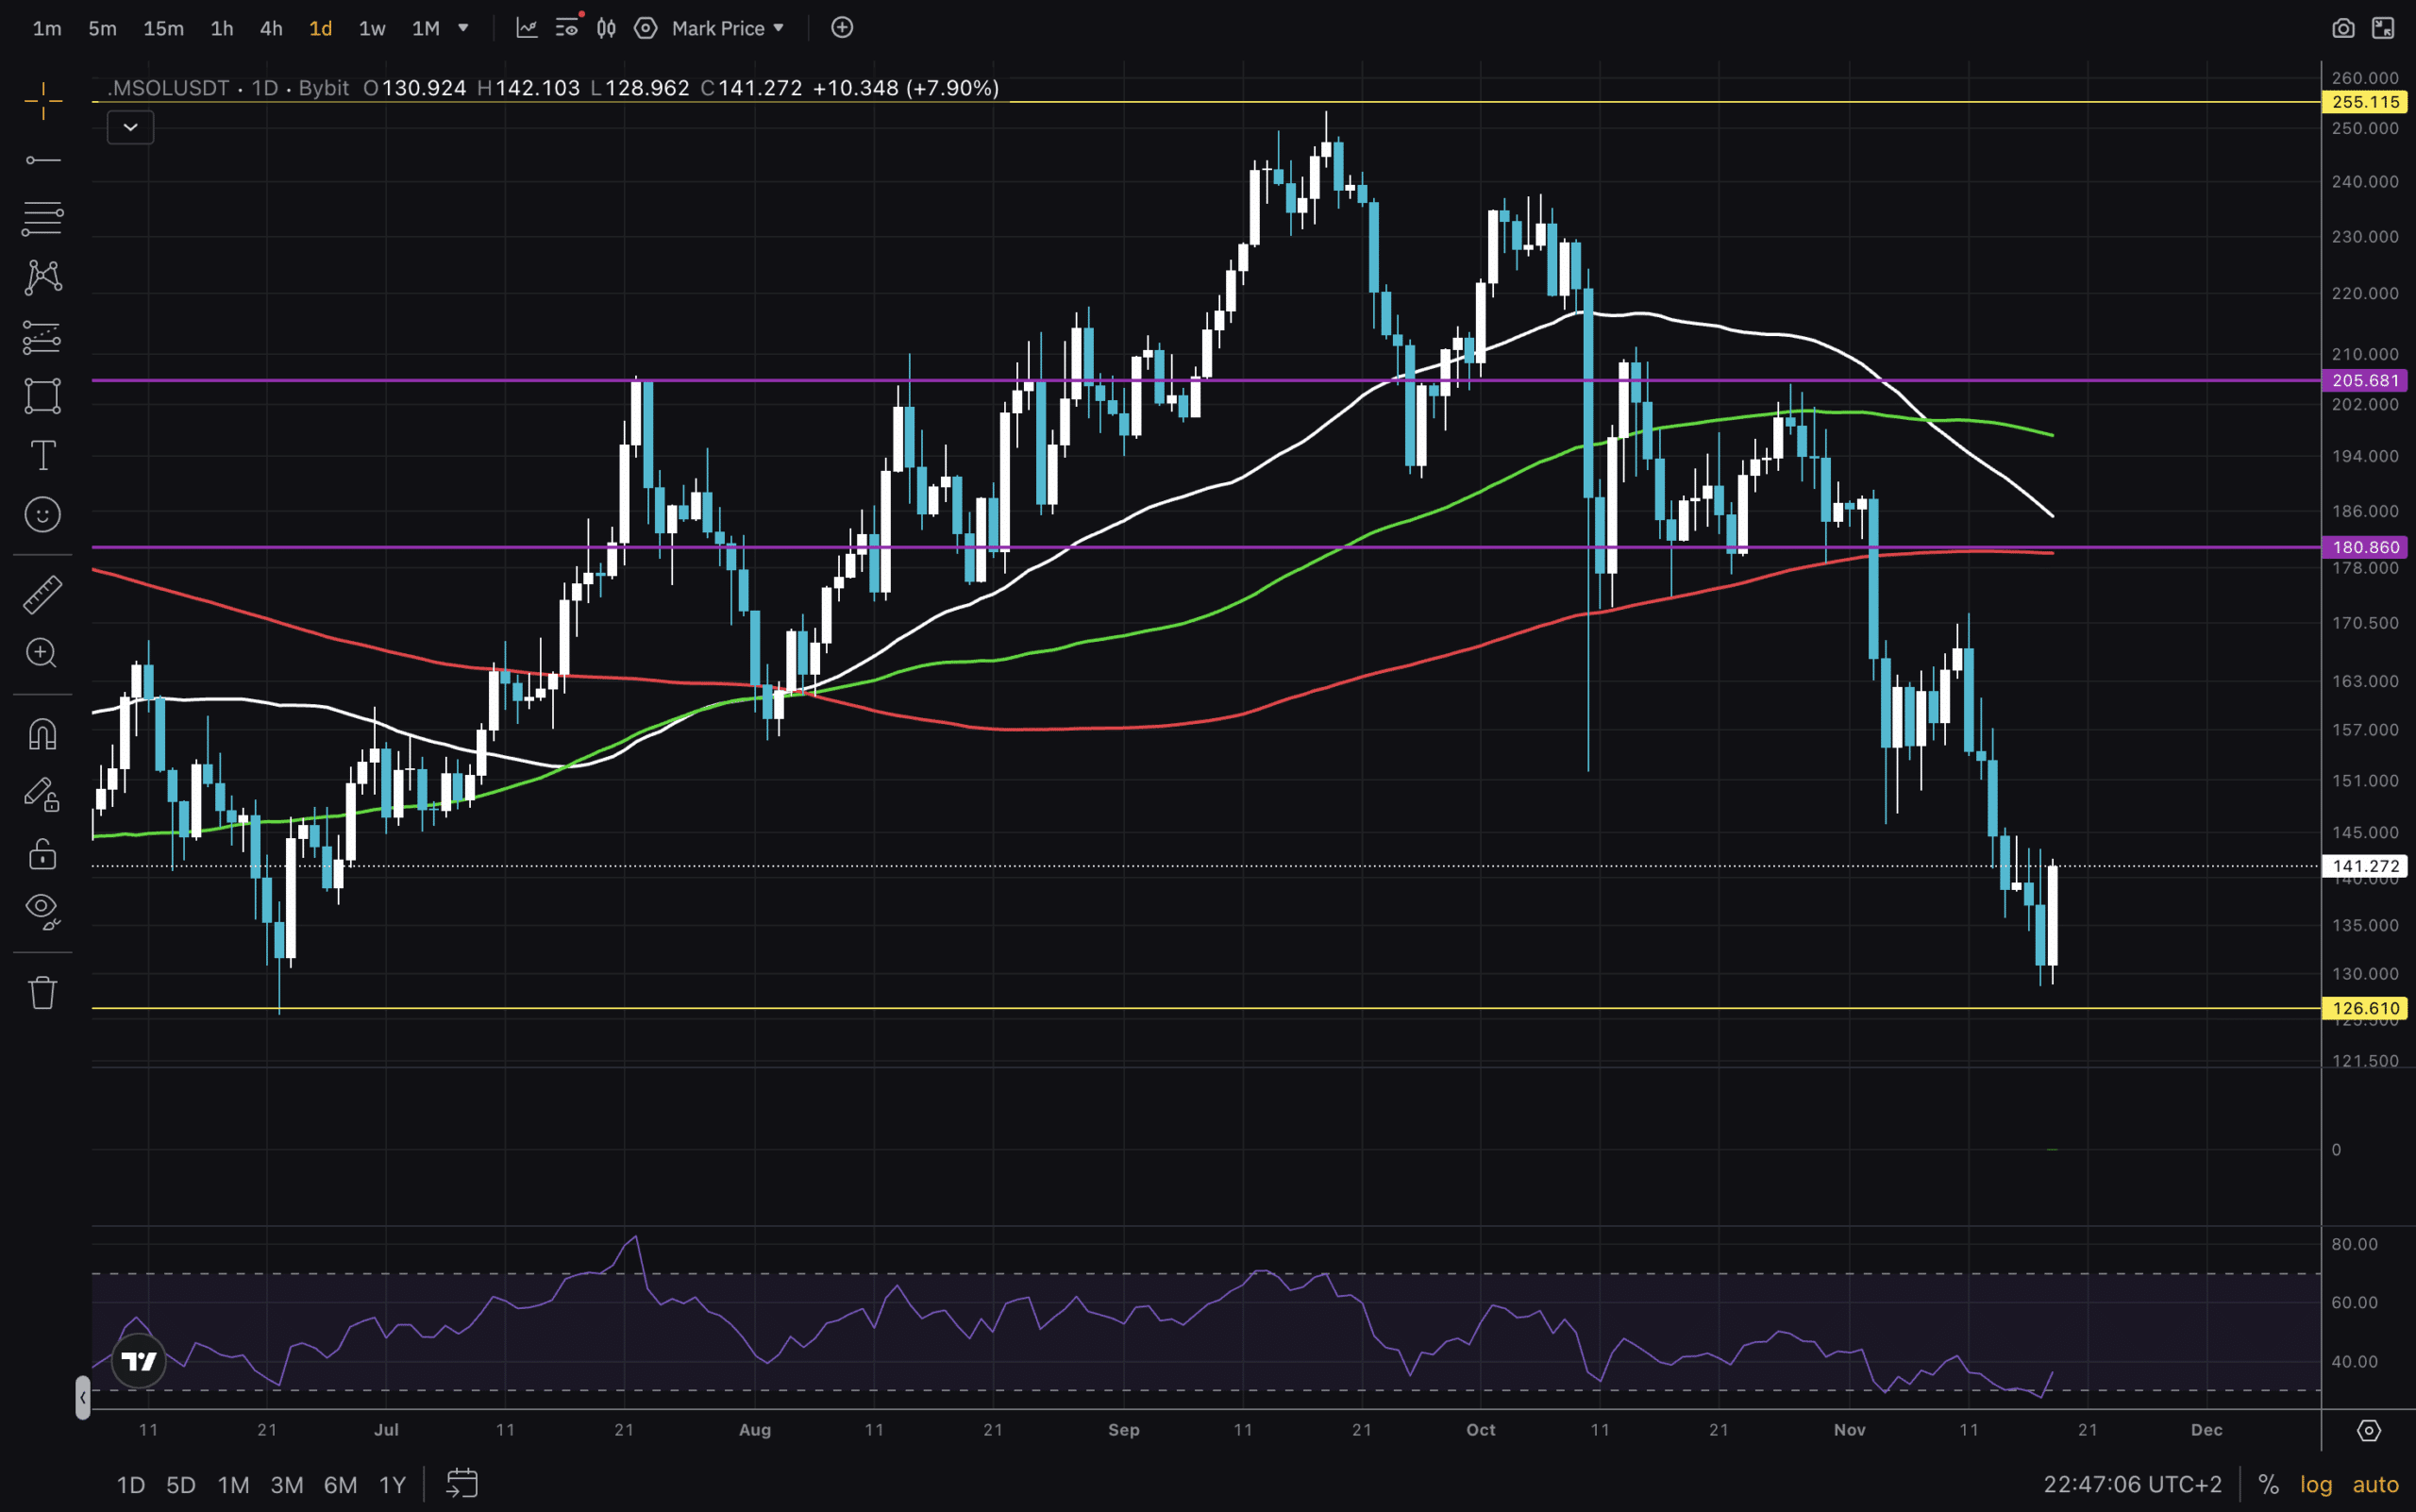
Finally, we will explore the Daily chart. There is this key zone/range from $180 to $205 that was lost and not even retested afterwards. That goes to show that there wasn’t sufficient liquidity in that zone, and market makers decided to hunt buyers at lower prices. As it stands now, the Solana price is below all Moving Averages and needs to reclaim them all to make a new attempt at a new ATH. Next, we examine the RSI and see that it appears to have bottomed. Let’s wait and see what the Daily candle close looks like.
It is a sit-and-wait game here for many. Investors might be DCAing here, but traders need to wait for confirmation, and Solana is in a no-man’s land at this point.
Stay safe out there!
DISCOVER: Best New Cryptocurrencies to Invest in 2025
Join The 99Bitcoins News Discord Here For The Latest Market Update
SOL USD Dips Below $140: How Long And How Much Deeper?
- SOL USD price broke below $180 support. Needs to reclaim for further upside!
- RSI on 1D bounced from oversold. Maybe a deadcat bounce to $160 is next.
- Price potentially found a higher low on the SOL BTC chart. Maybe.
- Solana ETFs are showing buyers are interested.
The post SOL USD Dips Below $140: How Long And How Much Deeper? appeared first on 99Bitcoins.
0
0
 Manage all your crypto, NFT and DeFi from one place
Securely connect the portfolio you’re using to start.


