
Pepe Price Prediction: What Caused PEPE to Fall 11.7% Today?

0
0

Pepe fell 11.7% in a single day, while just 665 whale wallets account for about 90% of its market value.
That mix of a sharp drop and heavy concentration frames this Pepe price prediction and the wider Pepe price prediction September 2026 outlook.
PEPE launched in April 2023 as an Ethereum-based meme token inspired by Pepe the Frog, a character created by cartoonist Matt Furie.
The Pepe coin has a fixed supply of 420.69 trillion tokens and now ranks 54th by market cap.
The Pepe price today is $0.00000441, down 11.7% over 24 hours and 9.0% against Bitcoin.
The 24-hour range runs from $0.00000429 to $0.00000503. Trading volume is $549.2 million, and market cap stands at $1.859 billion.
Live PEPE Market Data
Metric | Value |
Price | $0.00000441 |
24h Change | -11.7% |
24h Range | $0.000004298 to $0.000005037 |
Market Cap | $1.859B |
Source: market data taken from CoinGecko, as of Sep 24, 2026. Figures may vary slightly across other tracking websites.
Holder Concentration and Pepe News Today
No single headline explains the drop in the data reviewed. The clearest Pepe news this week sits in the holder figures instead.
For anyone checking Pepe news today, the main point is concentration.
The top 5 holders own 26.13% of the market cap, the top 10 own 35.65%, and the top 100 own 76.86%. Twenty holders each control at least 1% of the total supply of $PEPE.
Tier | Holder Count | % of Holders | % of Market Cap |
Whale | 665 | 0.11% | 90.02% |
Shark | 3,298 | 0.56% | 4.84% |
Dolphin | 21,382 | 3.61% | 3.38% |
Fish | 79,843 | 13.48% | 1.38% |
Crab | 163,790 | 27.66% | 0.34% |
Shrimp | 323,155 | 54.57% | 0.03% |
Source: Data Taken From Etherscan, as of Sep 24, 2026
The 665 whale wallets match the 665 wallets that each hold more than $100,000. Another 162 wallets hold more than $1 million.
The Gini score of 0.9938 sits very close to 1, the highest possible inequality. Roughly 592,000 wallets are tracked across the tiers, and more than half of them are shrimp with almost no weight.
Concentration cuts both ways. A few large wallets can support price through buying, or they can add heavy selling pressure.
The data shows how supply is spread. It does not show what these wallets plan to do.
Pepe Price Prediction: 1H Technical Analysis
This Pepe technical analysis uses the 1-hour PEPE/USDT chart on Binance, captured at 11:20 IST (UTC+5:30) on September 24, 2026.
PEPE rallied from around $0.00000400 to $0.00000536 on September 21 and 22. A falling trendline then formed from that peak. 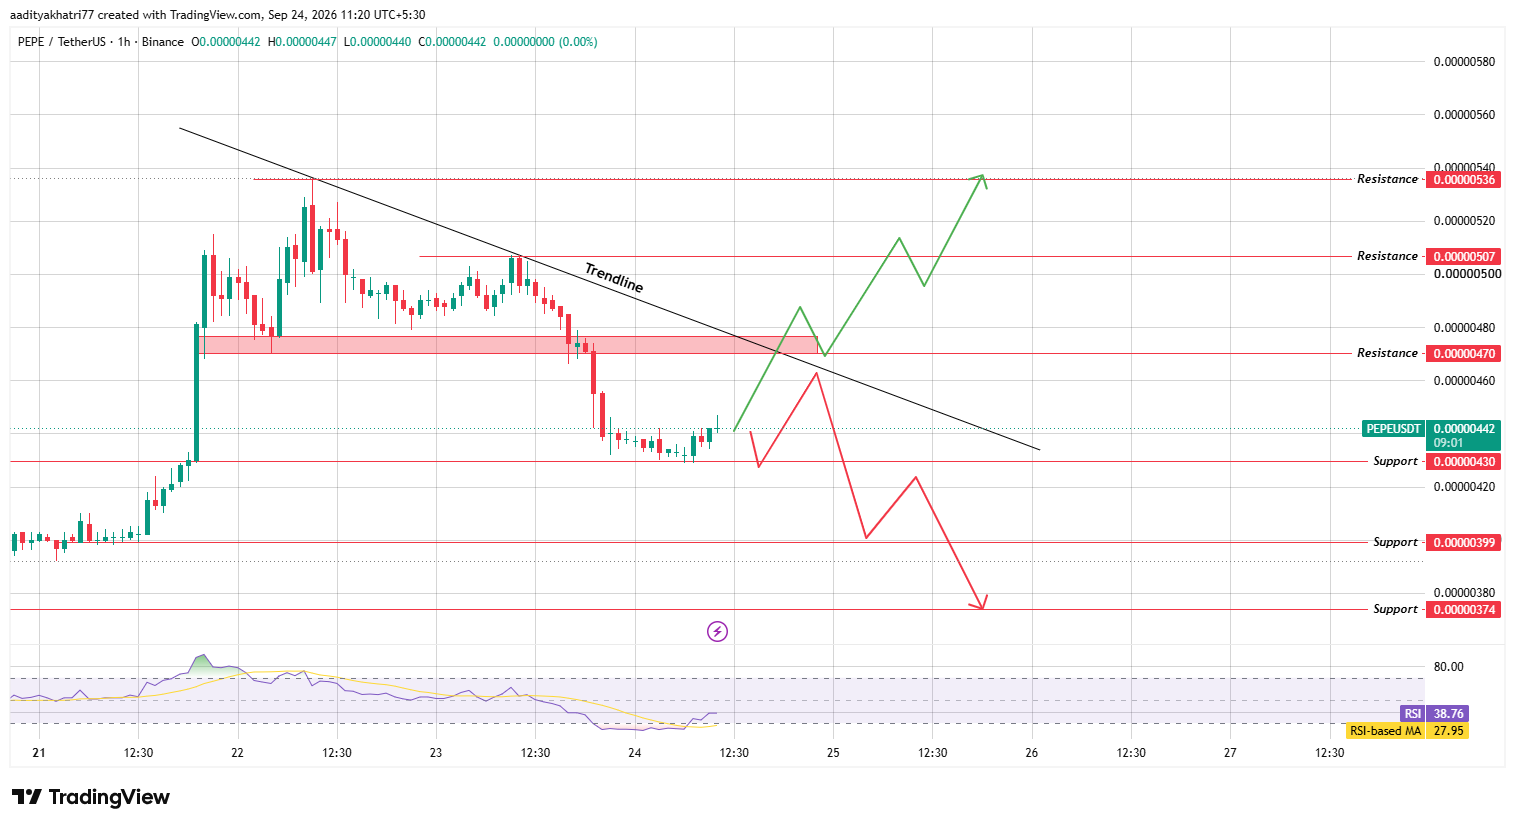
Source: Chart Taken From TradingView, as of Sep 24, 2026
On September 23, the price broke below the support zone near $0.00000470, and that zone has now turned into resistance.
Price sits under the falling trendline and is testing support at $0.00000430.
The RSI reads 38.76, still below the 50 midline but above its moving average of 27.95. Selling pressure has eased, yet momentum remains weak.
Daily volume of $549.2 million equals about 29.5% of market cap, so the drop came with active trading. Even after this fall, PEPE trades roughly 84% below its December 2024 peak near $0.000028.
Can PEPE Break the Trendline and Move Higher?
The bullish case needs a bounce from $0.00000430, followed by a PEPE breakout above the falling trendline.
That trendline runs close to the $0.00000470 resistance over the next session, so both hurdles sit in one area. Clearing $0.00000470 means a gain of about 6.3% from the chart price.
A 1H body close above both, with volume at least 1.5 times the average of the previous 20 candles, would confirm the move.
A wick above the line does not count. Only then could a PEPE bullish structure form, with higher lows and higher highs. Today the structure remains bearish, since lower highs still define the move.
The first Pepe price target is $0.00000507, about 14.7% higher, where the price was rejected on September 23.
The second is $0.00000536, roughly 21.3% higher, at the September 22 peak.
The chart shows a possible retest of the trendline before the second leg, which would be a normal pullback.
What Happens If PEPE Is Rejected at the Trendline?
The bearish case starts with rejection at the trendline or the $0.00000470 zone. Price would then fall back to $0.00000430.
A 1H body close below that support would open the next leg down.
The next downside level is $0.00000399, about 9.7% under the chart price. Below it sits $0.00000374, roughly 15.4% lower.
The chart marks small bounces on the way, so a decline may not run in a straight line. Traders should watch the reaction at the trendline first.
Pepe Price Levels Today
The table lists the Pepe price levels from the 1H chart. The Pepe price level today to watch first is $0.00000430 on the downside and $0.00000470 on the upside.
Support | Resistance |
$0.00000430 | $0.00000470 |
$0.00000399 | $0.00000507 |
$0.00000374 | $0.00000536 |
Pepe Coin Bull, Base, and Bear Scenarios
Scenario | Setup | Level |
Bull | 1H body close above the falling trendline and $0.00000470 with strong volume | $0.00000507, then $0.00000536 |
Base | Price holds $0.00000430 but stays below the trendline. | $0.00000430 to $0.00000470 |
Bear | 1H close below $0.00000430 | $0.00000399, then $0.00000374 |
Pepe vs Bitcoin
PEPE fell 11.7% in dollar terms and 9.0% against Bitcoin. Those figures imply Bitcoin lost roughly 3% in the same period. Most of the decline belongs to PEPE itself.
Meme tokens tend to swing harder than Bitcoin.
A steady Bitcoin would help any move above the trendline, while fresh Bitcoin weakness would raise the risk of a break below $0.00000430.
Readers building a Pepe price outlook should watch both charts together.
Expert Opinion
General market commentary on PEPE centers on two points. Traders usually read a broken support zone that turns into resistance as a sign of weakness until the price reclaims it.
Holder concentration adds a second risk, since a small group of wallets can shift supply quickly.
Any Pepe price prediction should sit alongside a fixed exit plan. PEPE fell 11.7% in one day, and gaps between levels can be wide.
Disclaimer: This article is for information only and is not financial advice. PEPE is highly volatile and fell 11.7% in 24 hours, and heavy holder concentration adds further risk. Technical levels can fail, and price can move against every scenario above, including a total loss of invested capital. The scenarios carry no stated probability. Do your own research and never risk money you cannot afford to lose.
0
0

 Manage all your crypto, NFT and DeFi from one place
Securely connect the portfolio you’re using to start.


