Hyperliquid May be Heading for a $10 Drop as the $37 Support Faces Key Test

0
0

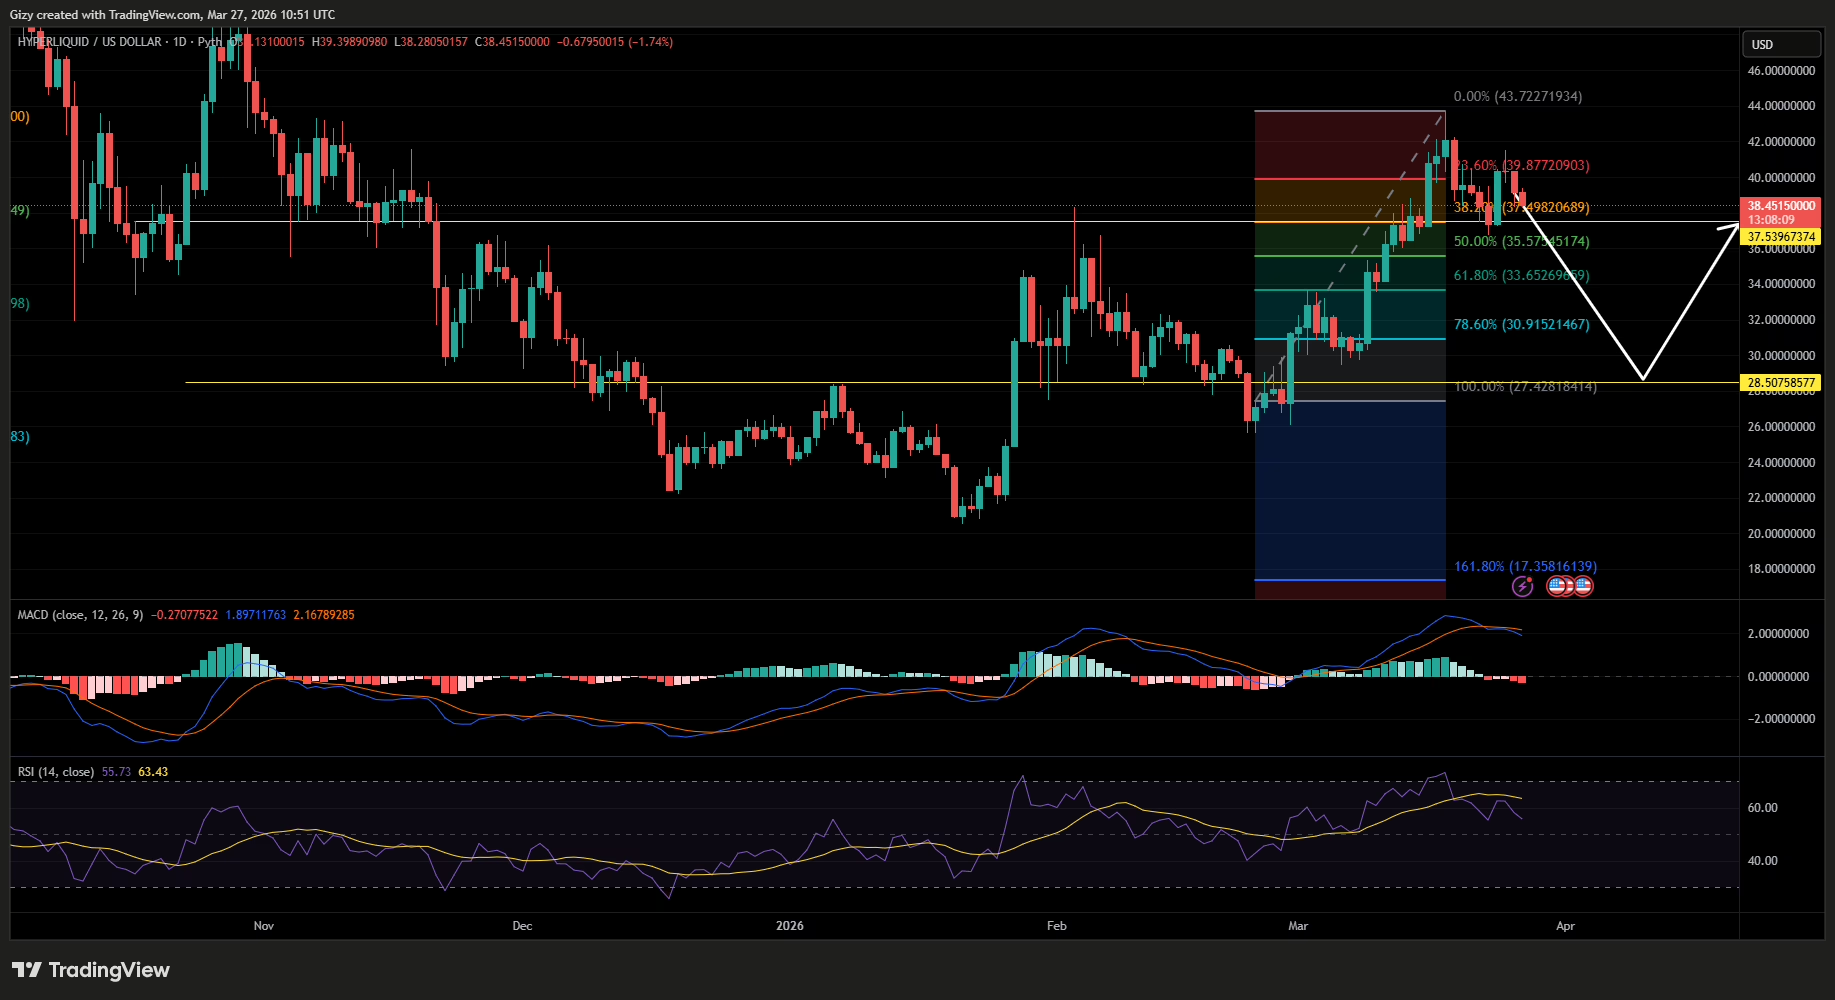
Hyperliquid surged to a high of $43.7 last Wednesday, but saw significant selling pressure after. As a result, it lost more than half its gains and ended the session up by 2%.
Interestingly, the surge occurred when the asset was overbought, and indicators showed it was due for correction. It was buoyed by fundamentals, which faded the next day.
A similar rally occurred on Tuesday, when the altcoin shot up from $37.3 to $40.4. It closed up by 8%, but lost momentum the next day. Hyperliquid has since been on the decline as excitement over an S&P 500 integration waned.
Investors were initially thrilled to learn that S&P Dow Jones Indices authorized its flagship index to carry out the first-ever S&P 500 perpetual futures contract on the Hyperliquid blockchain. However, the asset saw significant profit-taking in the days that followed.
HYPE is currently trading at $38.8. Although not significantly below its opening price, it shows that selling is still ongoing. Due to the current trend, it is edging closer to erasing all its gains on the weekly scale. It may end the week with notable losses if the recent trend persists, effectively posting its first red candle after two greens.
However, the chances of a reversal are slim. One analysis noted that geopolitical tensions are rising again. If this continues, the likelihood of fresh escalation increases. The market will no doubt decline in response.
Aside from fundamentals, the chart shows other reasons why a reversal is unlikely this time.
Hyperliquid Plots Second Shoulder
Zooming out to the 1-day chart, HYPE began a significant recovery attempt in late January. It peaked at $33 on Feb 3 and retraced afterward. However, it resumed an uptrend on the 28th, leading to an extended run that paused on Mar 18.
It remains to be seen whether the recent pause will mark a definitive end or a brief one. However, the described movement shows that the asset peaked twice: once in early January and again recently, which pushed the peak higher.
Hyperliquid printed the first shoulder and posted the head, which is yet to be confirmed as a head-and-shoulders pattern. Previous price movements suggest that since printing both parts, the next shoulder will follow.
The last part of this pattern may unfold in the coming days as the altcoin prepares for a massive downtrend. The moving average convergence divergence currently prints a sell signal, supporting the assertion of an impending decline. It recently had a negative crossover, sealing the downtrend.
Interestingly, previous movements provide a scale of what to expect. The last time MACD flipped bearish on the 1-day chart, prices retraced by over 23% before rebounding. A repeat of this trend will see HYPE drop as low as $32.
Previous price movement aligns with the MACD as a decisive flip of the $37 support has consistently signalled massive corrections. In most instances, it bounced off the highlighted level. This is also the same reading on the bollinger bands, which has its lower band at $33.
However, if the bulls fail to defend this key level, the altcoin may retrace below $30. This will guarantee it retests the head-and-shoulders neckline at $28. It will likely rebound, confirming the pattern.
The post Hyperliquid May be Heading for a $10 Drop as the $37 Support Faces Key Test appeared first on CoinTab News.
0
0

 Manage all your crypto, NFT and DeFi from one place
Securely connect the portfolio you’re using to start.


0
0

0
0

0
0