Solana Price Today Drops 38% Below Key Averages at $65.96 Amid Extreme Market Fear

0
0
Solana is trading at $65.96 amid a crypto market grappling with extreme fear, and recent charts reflect more than a simple dip. The Solana price today has moved roughly 38% below key moving averages, signaling a breakdown in buying conviction rather than typical market corrections.
The Daily Chart: Structural Damage With a Faint Lifeline
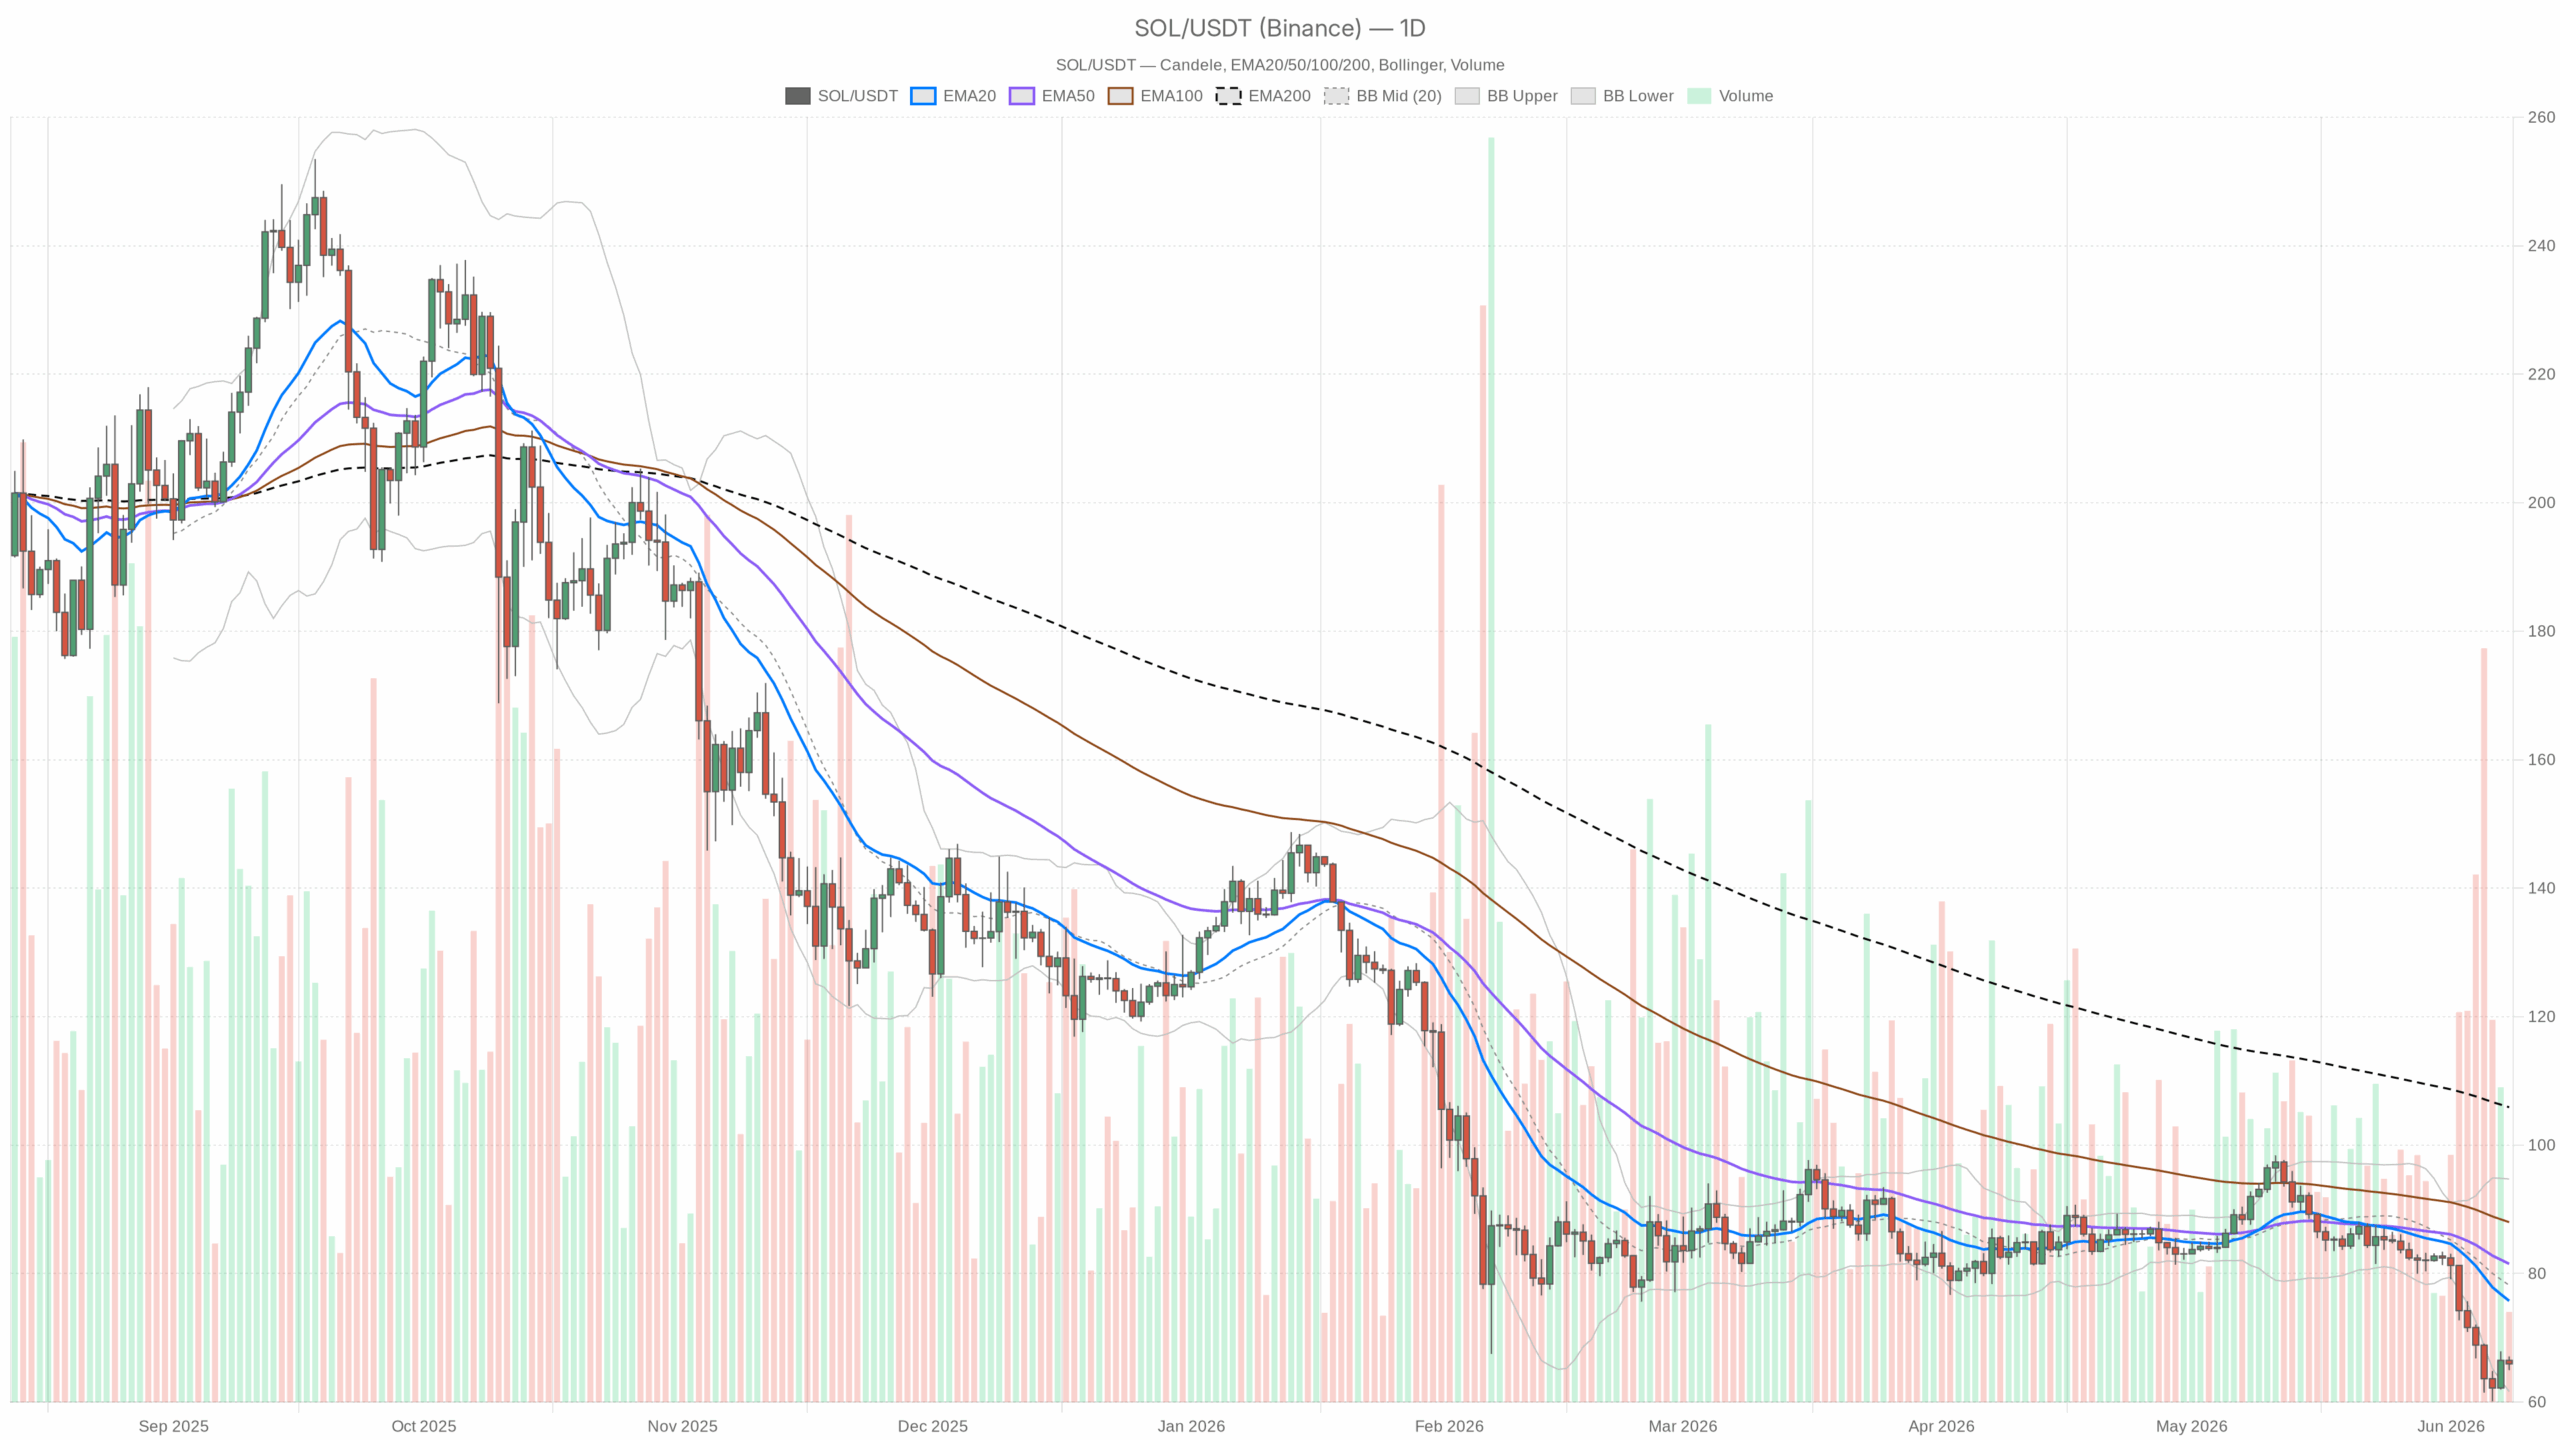
The daily chart reveals that Solana’s price is below the 20-day EMA at $75.76, the 50-day EMA at $81.53, and the 200-day EMA at $105.91, each acting as strong resistance levels. The nearly $10 gap to the nearest moving average underlines the need for a fundamental boost in buyer interest.
The RSI at 27.29 confirms oversold conditions but does not yet show bullish divergence, as the price continues to fall without a reversal signal. Additionally, the MACD remains strongly bearish with an accelerating negative histogram at -1.71, providing no hint of immediate recovery on the daily timeframe.
Bollinger Bands highlight that the price sits in the lower quarter range, currently around $65.96, with the lower band near $61.65 and the midline at $78.19—levels that emphasize the ongoing downtrend. The ATR of $4.15 implies high daily volatility, with price swings around 6%, highlighting risk management challenges.
The Hourly Chart: A Bounce Looking for Justification
On the 1-hour chart, Solana is trading above the EMA20 and EMA50, indicating a short-term upward move with an RSI of 56.26, suggesting some bullish momentum on the intraday. However, the EMA200 remains significantly above at $70.32, keeping the broader hourly trend bearish. The MACD histogram is nearly flat, signaling momentum is stalling rather than accelerating upward.
Hourly Bollinger Bands are tightening between $63.96 and $67.00, suggesting the market is coiling before a potential breakout, with the overall context still pointing toward caution.
The 15-Minute Chart: Short-Term Bulls Have the Ball, For Now
The 15-minute analysis shows a bullish EMA stack below price and a slightly positive MACD histogram at 0.05, with an RSI of 52.61. This indicates modest short-term bullishness, offering a path toward the $66.11 resistance pivot. Nonetheless, this movement remains within an hourly consolidation and a daily downtrend, marking it as a counter-trend bounce rather than a full reversal.
DeFi Activity: Solana Ecosystem Still Generating Volume
Despite the price decline, Solana’s DeFi ecosystem shows resilience. Protocols like Raydium AMM and Orca DEX reveal substantial fee growth, with Orca fees up 174% over seven days and 42% over 30 days. Meteora DLMM also reports an increase of 36.7% week-over-week. This suggests continued on-chain activity, which may provide underlying support.
The Bull Case: Extreme Oversold + Active Ecosystem
Bulls argue that the extreme oversold daily conditions, combined with a Fear & Greed Index near 8, historically close to local bottoms, could herald a recovery. Should Bitcoin’s dominance decrease, capital may flow back into altcoins like Solana. The immediate recovery target would be the $67.05 resistance pivot and then the $70+ zone by the hourly EMA200. A decisive bounce requires volume and MACD histogram compression toward zero to indicate weakening bearish momentum.
This bullish scenario fails if Solana closes below $64.92 on the daily and heads toward the $61.65 Bollinger lower band, which would suggest further downside is likely.
The Bear Case: Dead Cat Bounce in a Broken Trend
Bears view the current setup as a relief rally in a strong ongoing downtrend. The daily EMA alignment, MACD acceleration downward, and sustained Bitcoin dominance indicate risk-off sentiment. The short-term intraday bounces could be moments for institutions to offload positions, with $67–$68 as a key distribution area rather than recovery.
This bearish view would be invalidated if Solana closes the day above $70 with rising volume and if the hourly RSI surpasses 65, which would signal fresh accumulation rather than just a dead-cat bounce.
What This Means for How You Approach the Market
The conflicting signals across timeframes form a complex picture. The daily remains bearish, the hourly shows tentative recovery, and the 15-minute chart is bullish. Overall, Solana appears in a relief bounce within a broader downtrend, not a reversal. Short-term traders might capture gains toward $66.50–$67, but holding beyond hourly resistance without catalysts entails higher risk.
High volatility driven by an ATR of $4.15 and extreme fear sentiment requires patience and disciplined position sizing. Structural market confirmation from the daily timeframe is essential before making longer-term bets.
0
0

 Manage all your crypto, NFT and DeFi from one place
Securely connect the portfolio you’re using to start.

0
0


0
0