Bitcoin Price Review: BTC, ETH, TON, NEO, TIA
13d ago•

bullish:
0
bearish:
0
Share

Today’s market session has seen bulls regain control of the markets as evidenced by the increase in the global market cap over the last 24 hours. The global cap stood at $2.26T as of press time, representing a 1.26% jump from its previous 24-hour one while the trading volume also jumped by 4.7% to $102.2B.
Bitcoin Price Review
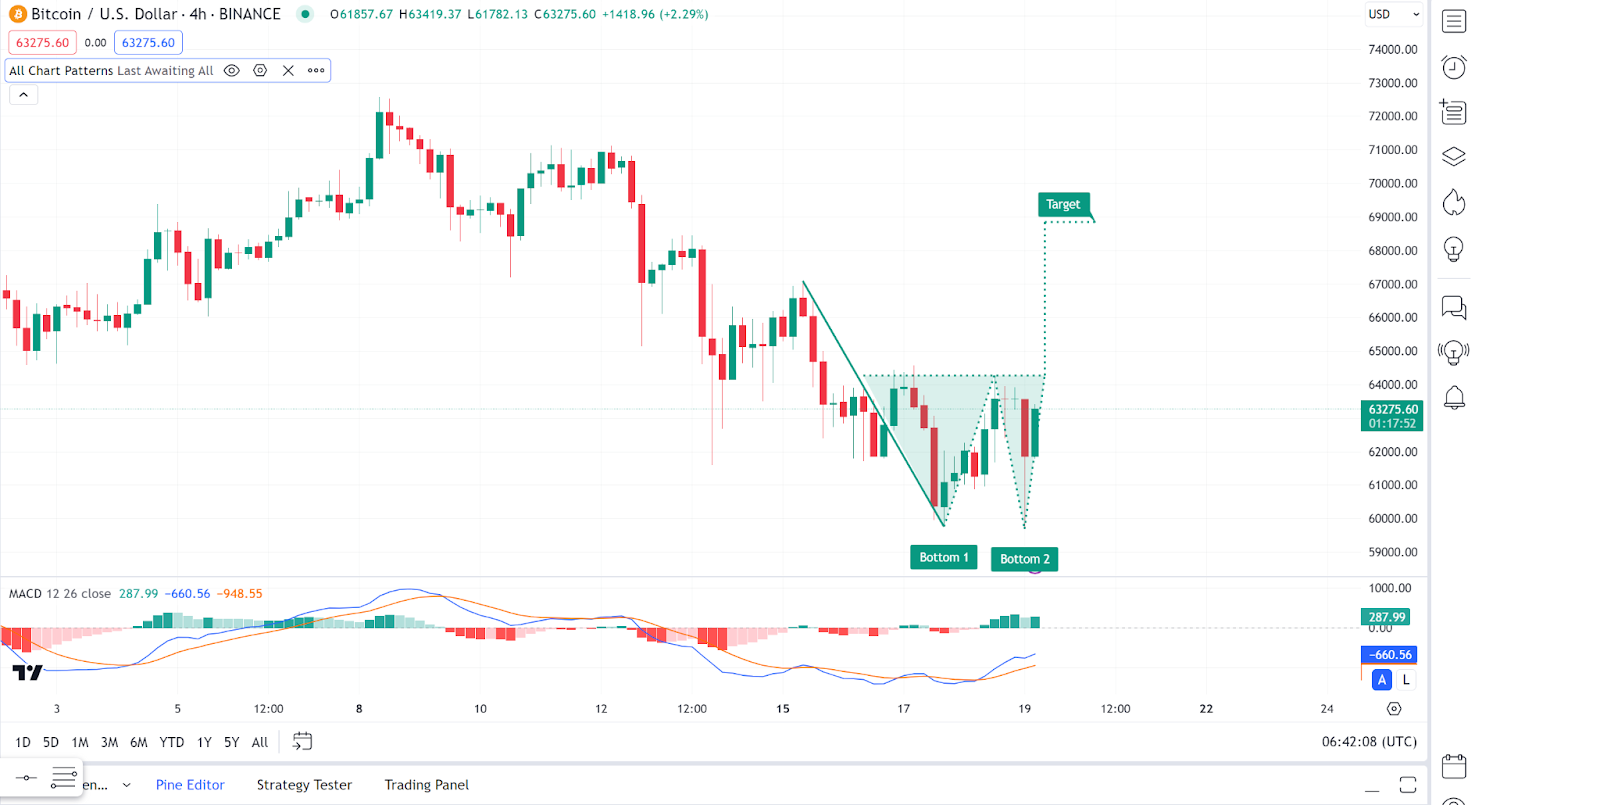
Bitcoin (BTC) is still on a recovery run, as evidenced by its upward movement during today’s session. Analysing Bitcoin charts, we notice two bottoms, indicating a potential double bottom pattern, which is another bullish reversal signal.
On the other hand, the MACD indicator below the chart shows a bullish crossover, with the MACD line crossing above the signal line, further supporting the potential for a trend reversal. As of press time, the Bitcoin price stood at $62,826, representing a 6.1% increase from its previous 24-hour price.
Ethereum Price review
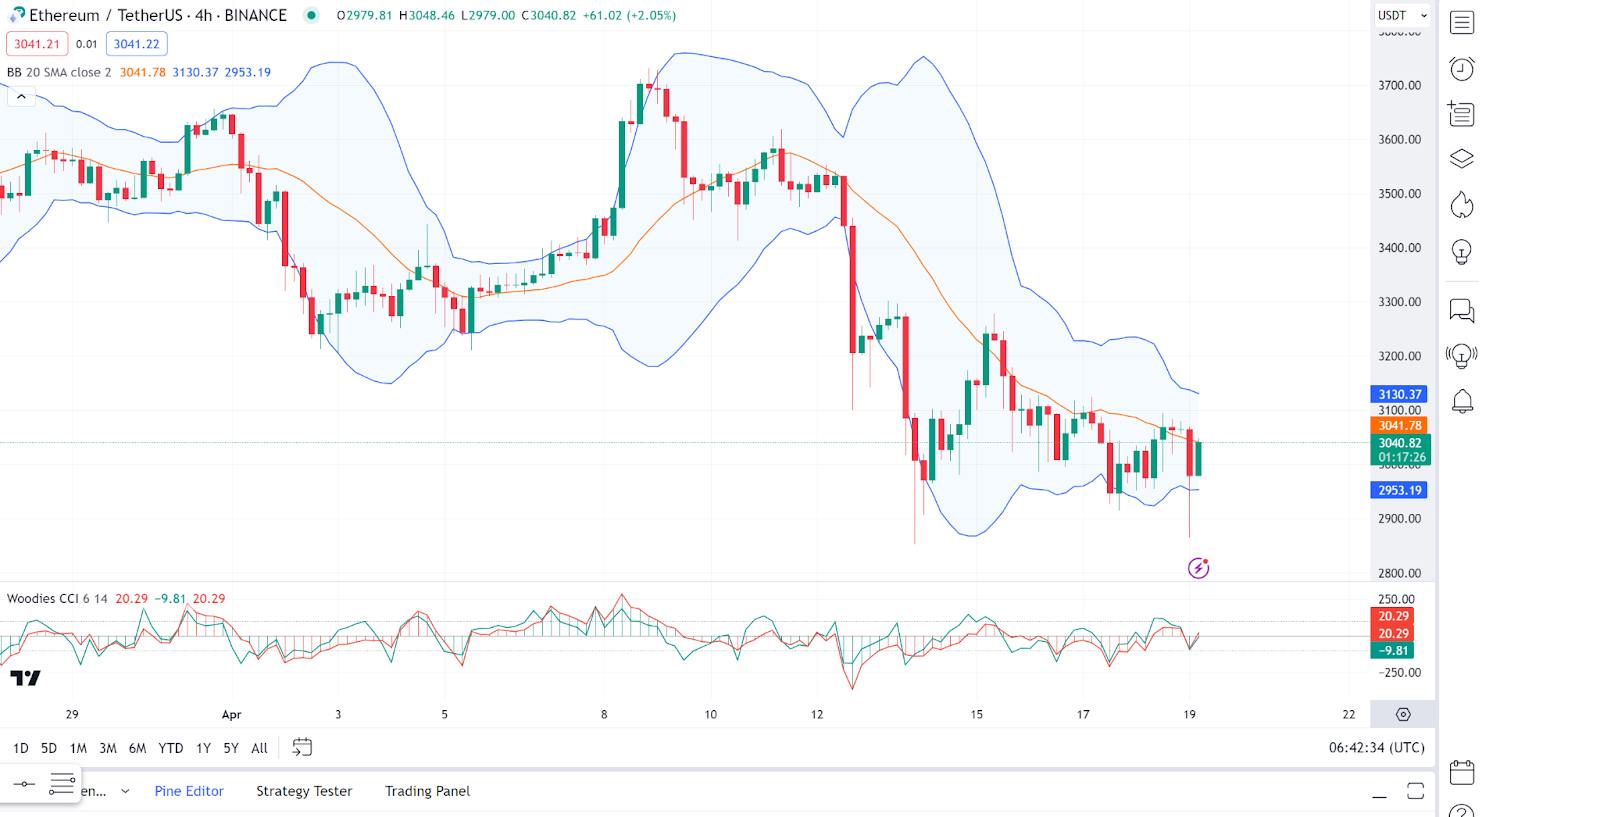
Ethereum (ETH) has also been on a recovery run in today’s session, displaying some notable gains. Looking at an in-depth analysis, we notice the Ethereum price is oscillating between the upper and lower bands of the Bollinger Bands, which suggests a ranging market in the short term. The Bollinger Bands are contracting, which often precedes a period of increased volatility.
The Ethereum price is currently near the middle band, indicating a neutral position in the short term. On the flip side, the Woodies CCI shows the price momentum oscillating around the zero line, which doesn’t indicate a strong trend. As of writing, the Ethereum price stood at $3,102, representing a 4.3% increase from its previous 24-hour price.
Toncoin Price Review
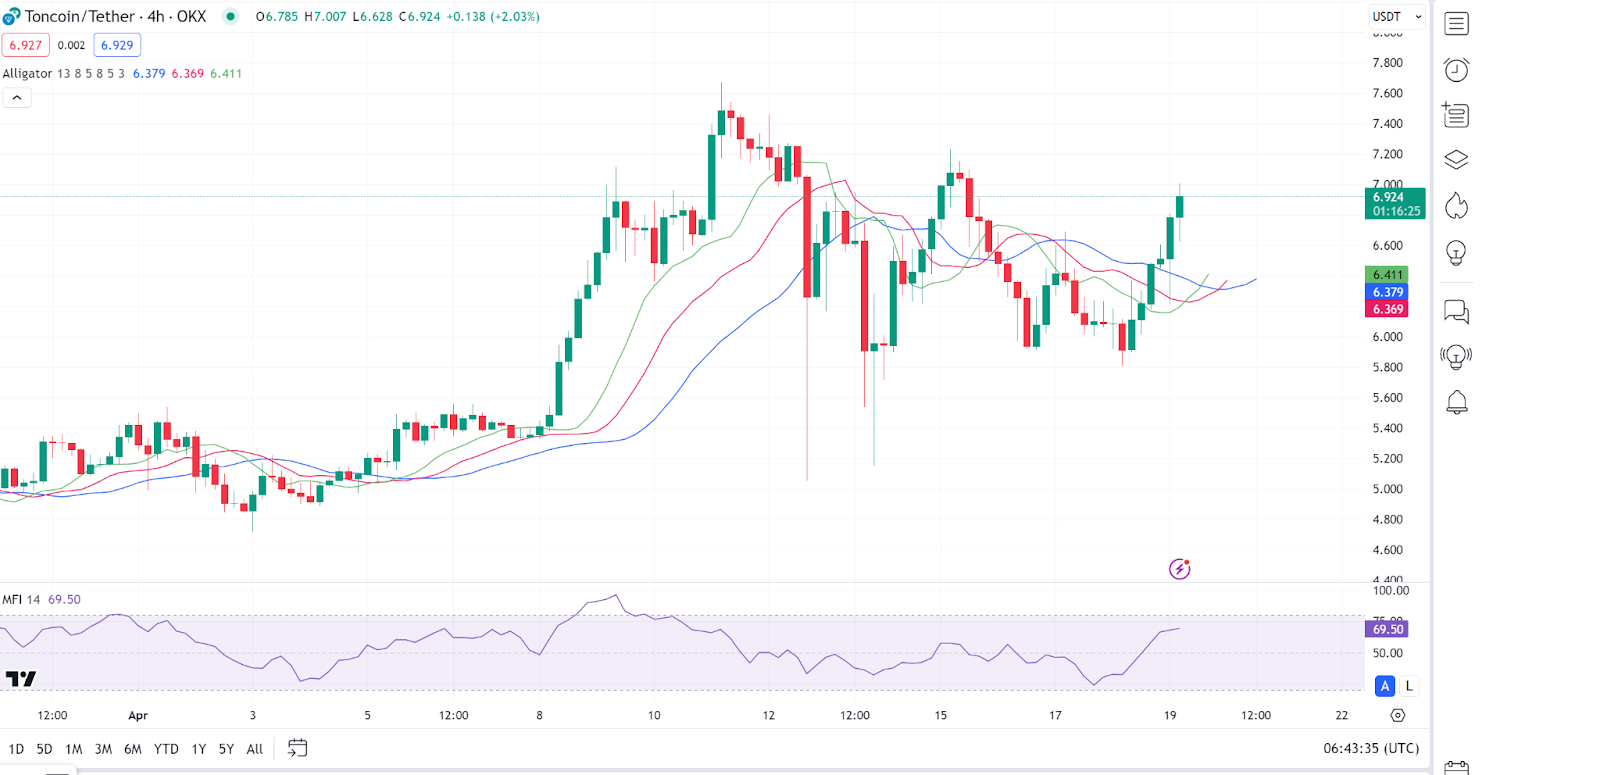
Toncoin (TON) was also among the top gainers in today’s session, posting remarkable gains. Analysing Toncoin price charts, we notice that the Alligator indicator, with its three moving averages, is intertwined, indicating a lack of trend and a possible consolidation or ranging market.
On the other hand, the MFI (Money Flow Index) is high, suggesting that the buying pressure is intense, which could mean the price might continue to go up if the trend resumes. As of writing, the Ethereum price stood at $6.93, representing a 17.8% increase from its previous 24-hour price.
Neo Price Review
Neo (NEO) is also among the top gainers once again, having posted some notable gains today. Looking at Neo price charts, we notice that the Supertrend indicator is green and below the price, suggesting a bullish signal.
Conversely, the ADX (Average Directional Index) is below 20, indicating a weak trend and consolidating market conditions. As of writing, the Neo price stood at $19.34, representing a 17.04% increase from its previous 24-hour price.

Celestia Price Review
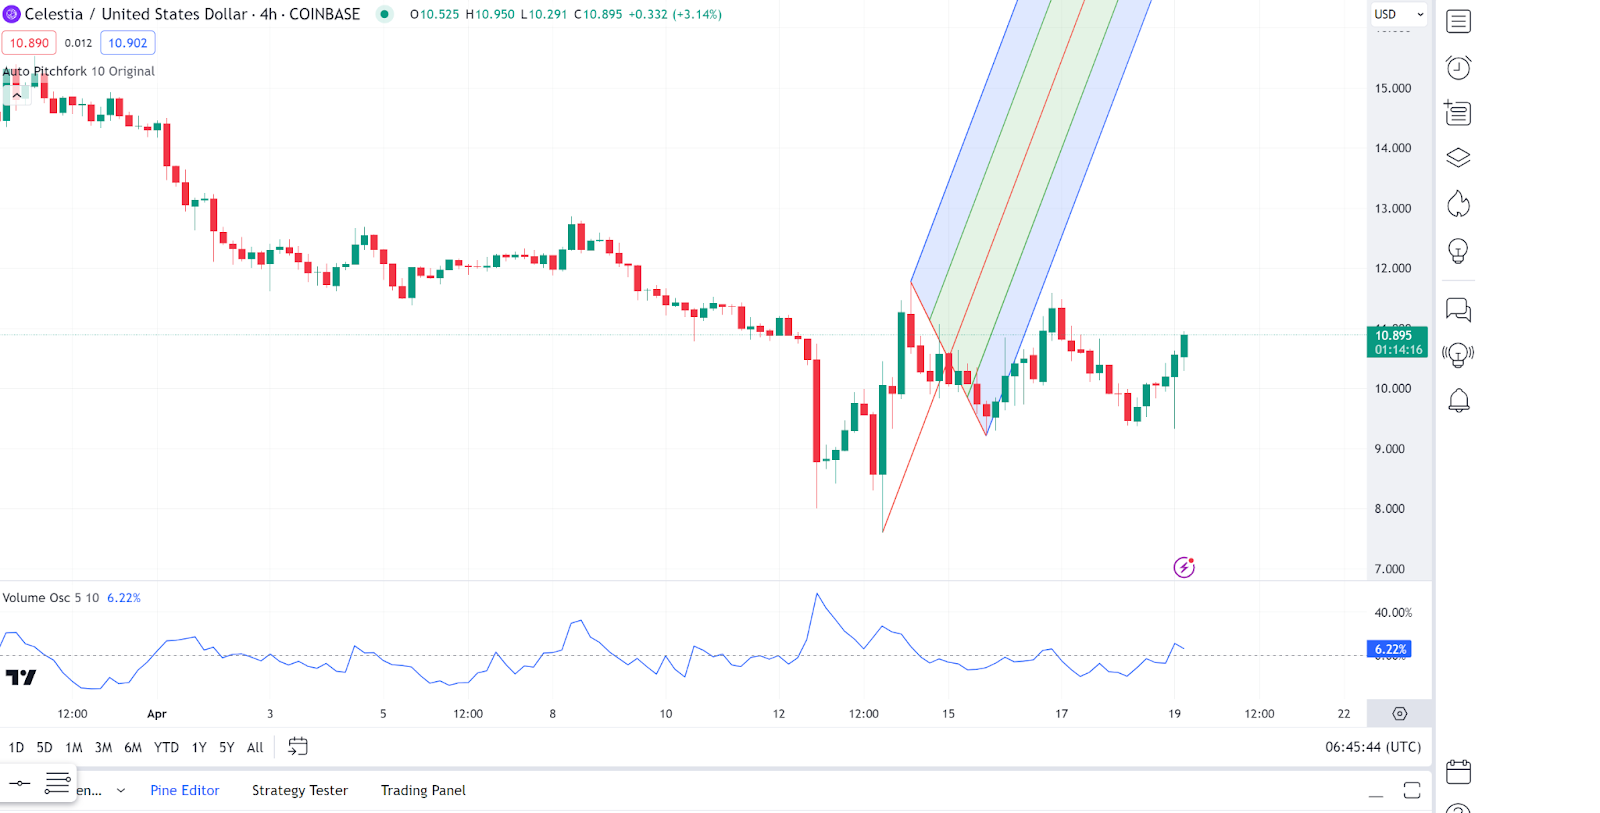
Celestia (TIA) was another gainer in today’s session, posting some notable gains as well. An Auto Pitchfork indicator is applied, showing upward-sloping price movements within the channel. The recent breakout from the channel confirms the current bull action, as evidenced by the latest series of green candlestick patterns.
Conversely, the Volume Oscillator is above zero, suggesting higher volume on upward price moves. The positive value of the volume oscillator indicates buying pressure. As of writing, the Celestia price stood at $11.2, representing a 17.91% increase from its previous 24-hour price.
13d ago•
bullish:
0
bearish:
0
Share


 Manage all your crypto, NFT and DeFi from one place
Securely connect the portfolio you’re using to start.

bullish:
0
bearish:
0

bullish:
0
bearish:
0

bullish:
0
bearish:
0

bullish:
0
bearish:
0