Crypto Market Price Analysis Today: Bitcoin (BTC), Fetch.ai (FET), SingularityNET (AGIX), Ocean Protocol (OCEAN), Mantle (MNT)
30d ago•

bullish:
2
bearish:
0
Share

Bitcoin continues to draw the attention of investors as it emerges from a bull flag pattern. Several experts suggest that this bullish pattern could send Bitcoin to new all-time highs this week.
Amidst the recent market swings, triggered in part by the withdrawal from the U.S. Spot Bitcoin ETF last week, Bitcoin has managed to sustain investor interest, as indicated by significant fund inflows. Its climb to a record peak of $73,750 in mid-March highlighted its durability in the face of market swings. Nevertheless, the market saw a period of instability following the ETF outflows, leading to a temporary decline in investor hope.
This trend appears to have changed this week, with a revival in ETF fund inflows marking a return of confidence from Wall Street in *BTC*. This renewed interest from institutions also fuels discussions about potential further increases in Bitcoin’s value.
In the midst of these discussions, Ali Martinez, a well-known crypto market analyst, has pointed out a possible breakout from a bull flag pattern on Bitcoin’s 4-hour chart. Martinez forecasts that, should Bitcoin remain over $70,000, a near 10% rise to $77,000 could soon follow.
Following this, will there be a recovery for leading altcoins in the coming days? Let’s find out.
Bitcoin Price Analysis (BTC)
Bitcoin recently emerged from its consolidated pattern of the past several days, indicating that buyers are now dominating the market. BTC price surged above immediate Fib lines and neared the $72K mark, likely aiming to touch new ATH by the weekend. However, sellers will strongly defend a surge above $74K. As of writing, BTC price trades at $71,257, surging over 2.7% from yesterday’s rate.
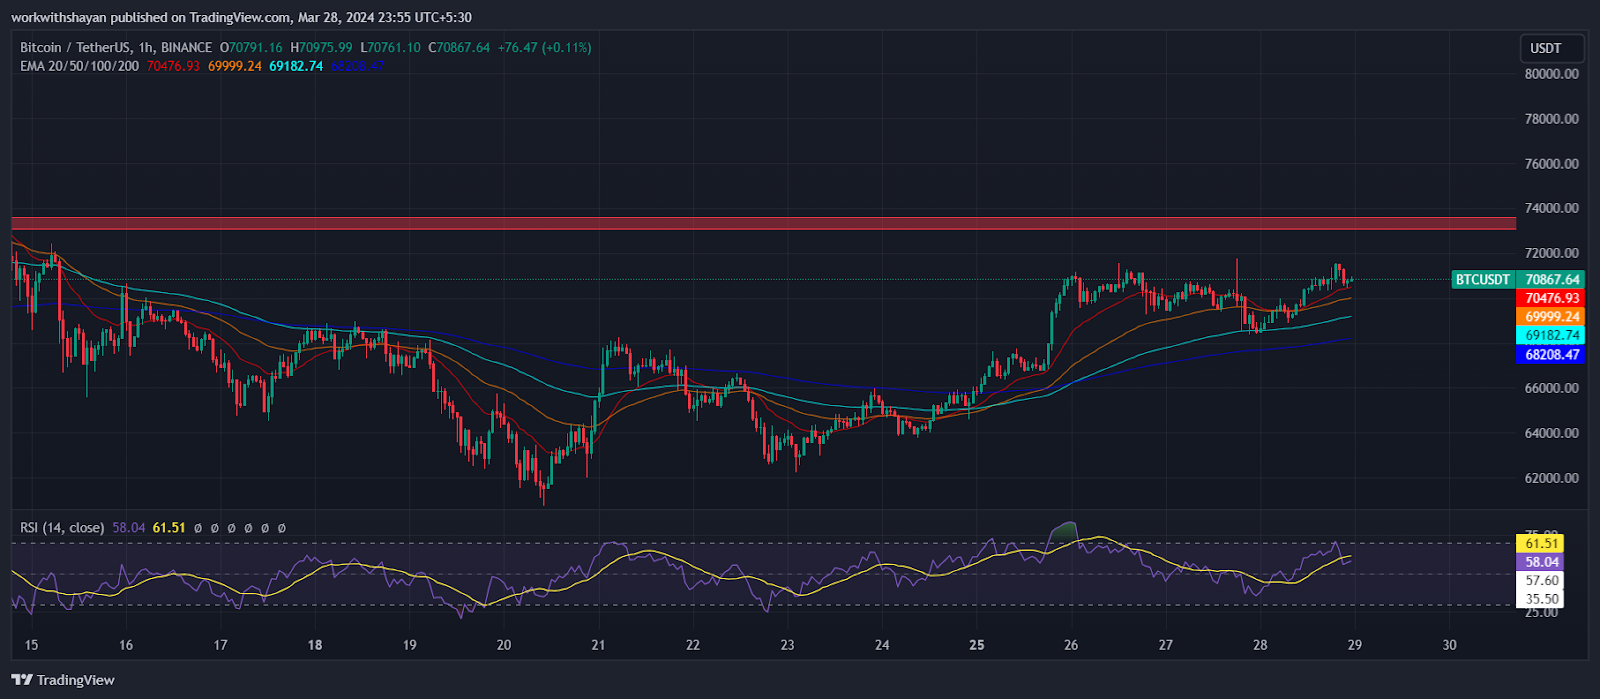
BTC/USD Chart On TradingView
Should they manage to keep the price above the EMA trend line, it’s anticipated that the BTC/USDT pairing might climb to meet significant resistance at $73,777. At this juncture, it could present a formidable obstacle; however, if buyers continue to dominate, a surge towards $80,000 is on the cards.
On the flip side, a decline from its present level could hint at the breakout being a false bullish signal. In such a case, sellers will aim to push the price beneath the lower boundary. Achieving this could lead the pairing to fall towards the 50-day Simple Moving Average (SMA), currently at $68.7K.
Fetch.ai (FET) Price Analysis
The recent relief rally in FET price has breached the key resistance level at $3.3, signaling a significant trend to monitor. However, sellers are aiming to halt the current rally near $3.5. As of writing, FET price trades at $3.4, surging over 10.8% from yesterday’s rate.
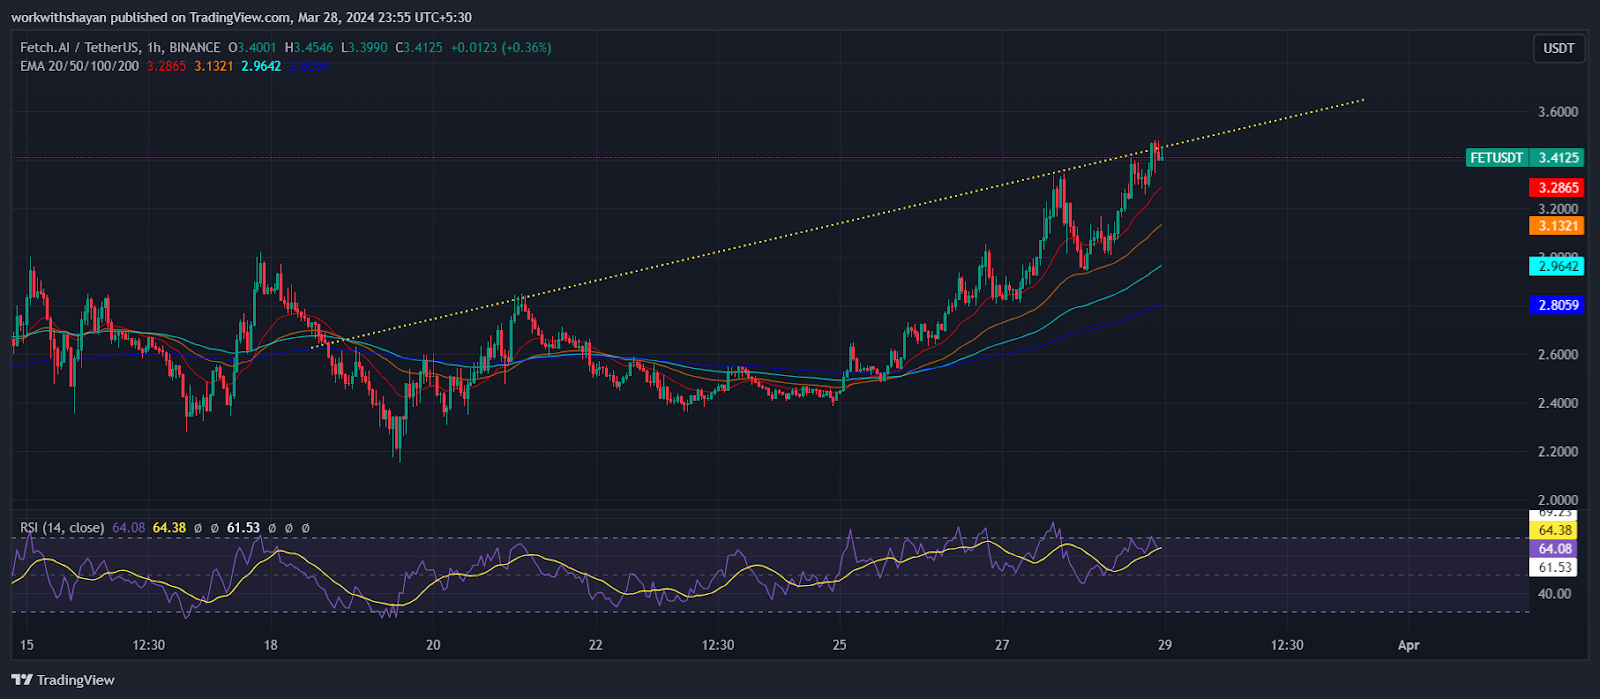
FET/USD Chart On TradingView
The upward trajectory of the moving averages, coupled with the RSI positioned in the favorable zone, indicates that the momentum is likely skewed upwards. Should the buyers maintain the price above $3.5, the FET/USDT trading pair could gain further traction, potentially reaching the $4 mark. While this price point could present a solid barrier, surpassing it might lead the pair towards the $10 level.
On the flip side, to curb the ascending trend, sellers must pull the price beneath the 20-day EMA, situated at $3.2. Achieving this could see the pair retracting to the 50% Fibonacci retracement level at $2.9.
SingularityNET (AGIX) Price Analysis
The AGIX price has been on an upward trajectory, breaking through the $1 barrier and now targeting the $2 milestone as its next goal. However, efforts to push further were met with resistance at $1.5. Currently, AGIX price trades at $1.4, surging over 11.4% in the last 24 hours.
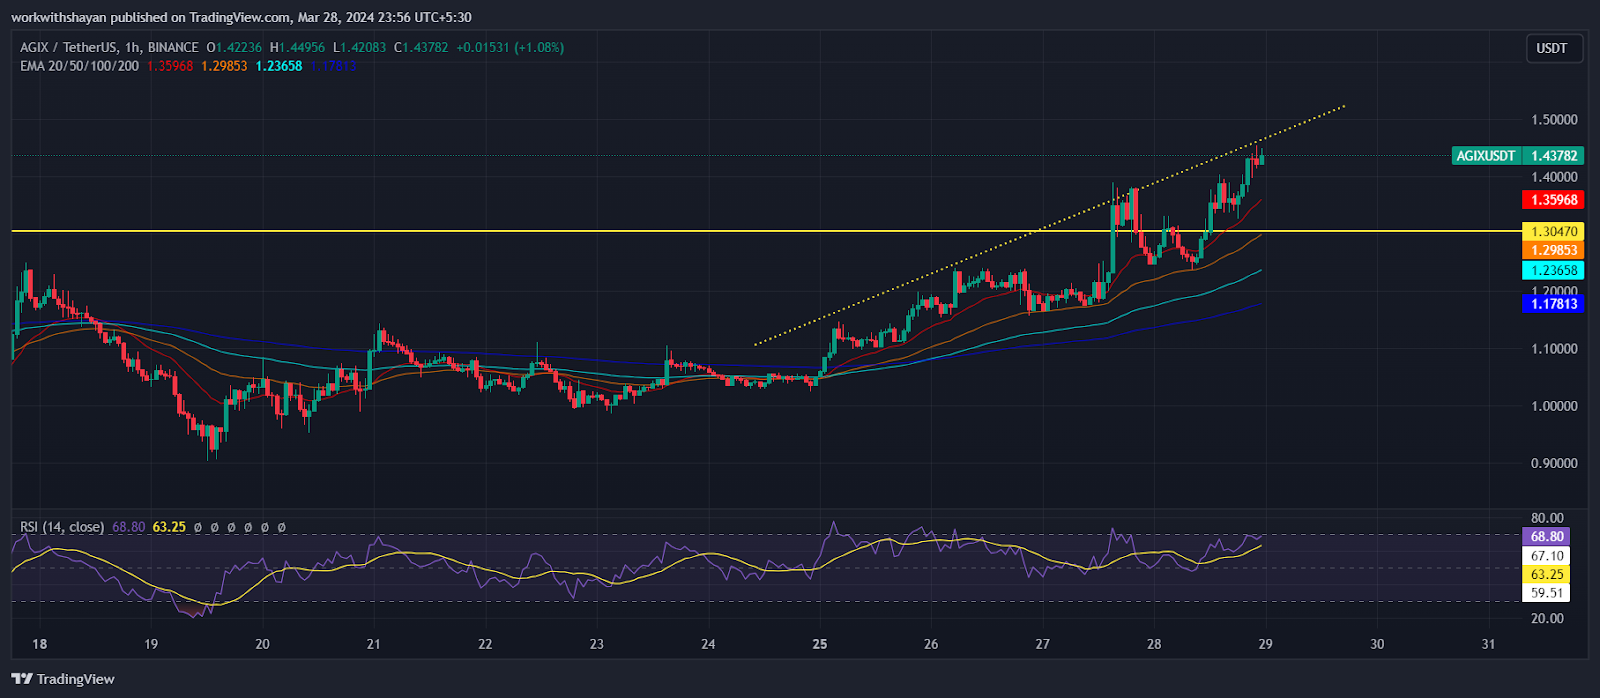
AGIX/USD Chart On TradingView
If the bulls can maintain their ground around this price level without substantial losses, it implies a strong interest in buying during minor declines, thereby increasing the chances of reaching the $2 target.
Conversely, the first layer of support lies at the 20-day Exponential Moving Average (EMA) at $1.3, with an additional safety net at $1. A failure to hold these levels could lead to a deeper correction down to the 50-day Simple Moving Average (SMA) at $0.91. It is crucial for the upward momentum to stay above this key level, as falling below it may signal a change in the current trend.
Ocean Protocol (OCEAN) Price Analysis
OCEAN has seen a rebound above the 20-day EMA ($1.4) recently, signaling ongoing competition between buyers and sellers. Buyers continue to dominate as they break through immediate resistance and Fib channels. As of writing, OCEAN price trades at $1.5, surging over 12% in the last 24 hours.
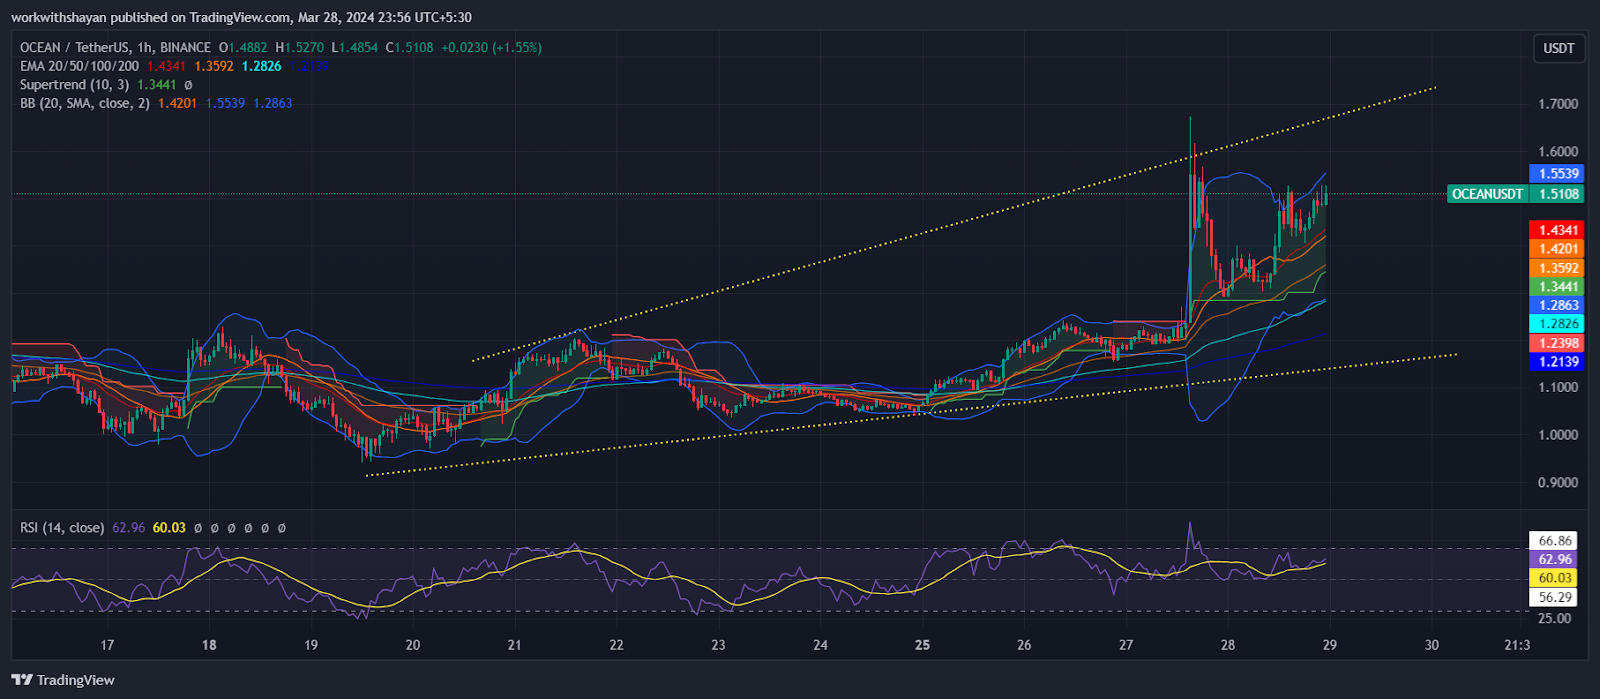
OCEAN/USD Chart On TradingView
With the 20-day EMA appearing upwards and the RSI heading toward the overbought region, bulls have a solid upper hand. Consequently, the OCEAN/USDT pair might fluctuate within the range set by the uptrend line and $2 for some time.
Should the bulls manage to drive the price beyond $2, we could see the pair ascend towards the next significant resistance at $2.4, a level where bears are likely to mount a strong resistance.
Conversely, if the price falls below the EMA line, it would indicate that bears have gained control, potentially leading to a decline towards $1.1.
Mantle (MNT) Price Analysis
Mantle’s recent surge has encountered significant resistance at the $1.5 mark, a point where sellers are expected to strongly counter. As a result, MNT price declined below Fib levels and consolidated around the bearish zone of $1.1. However, buyers defend a decline below the support line. As of writing, MNT price trades at $1.2, declining over 7% in the last 24 hours.
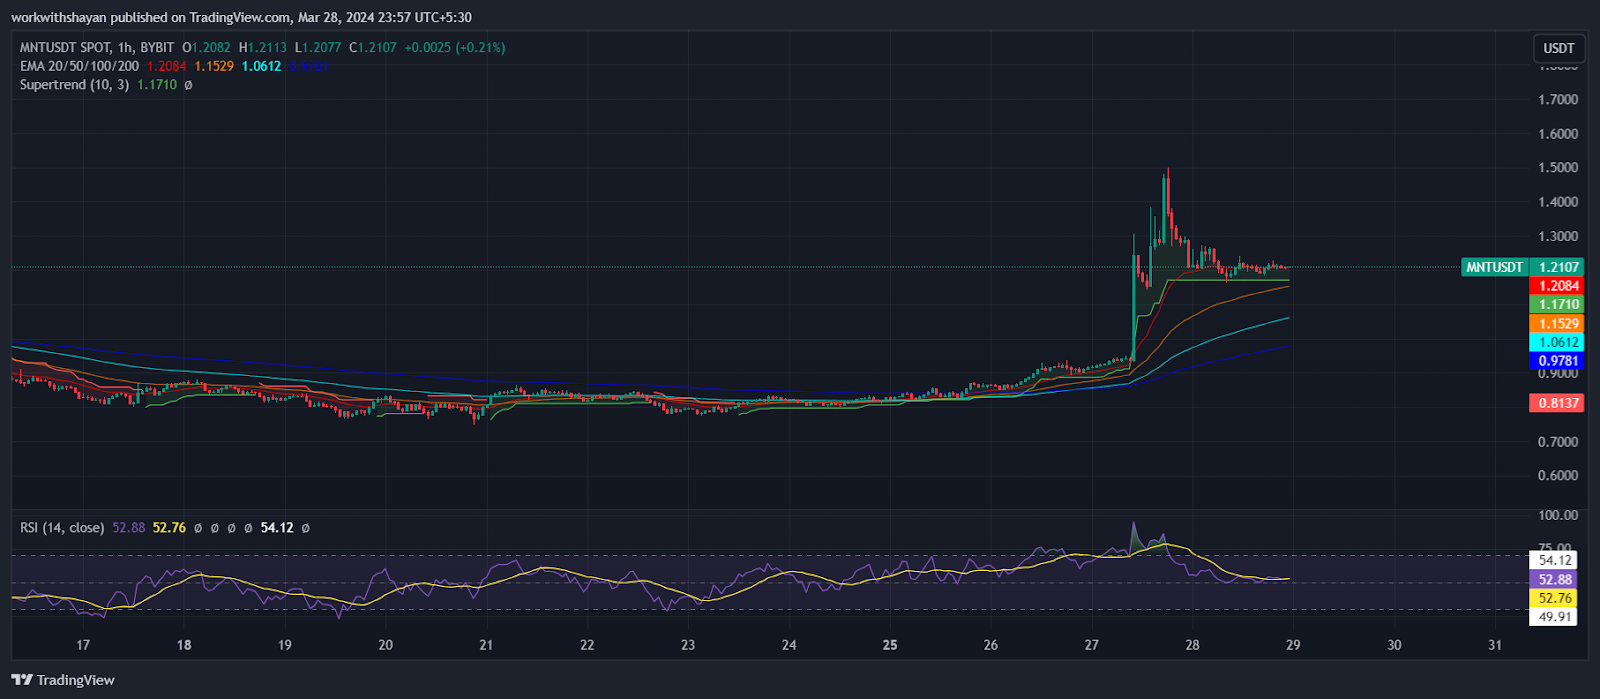
MNT/USD Chart On TradingView
The 20-day Exponential Moving Average (EMA) stands at $1.2, showing a neutral momentum, and the Relative Strength Index (RSI) is around the midline, suggesting that the momentum may currently be in an equilibrium state. Should the buyers maintain their position close to the current level, the chance of breaking above $1.5 becomes more likely. In such a scenario, MNT/USDT could rise to $1.8, and potentially reach $2.1 thereafter.
On the flip side, a sharp decline from this level could indicate a continuation of the sideways trading pattern, with the pair oscillating between $1.2 and $0.8.
30d ago•
bullish:
2
bearish:
0
Share


 Manage all your crypto, NFT and DeFi from one place
Securely connect the portfolio you’re using to start.

bullish:
0
bearish:
0

bullish:
0
bearish:
0

bullish:
0
bearish:
0

bullish:
0
bearish:
0