
Cosmos Price Prediction: Can ATOM Sustain Its Breakout?

0
0

ATOM Breaks Above Its Descending Channel
Cosmos (ATOM) is trading near $1.40 after breaking above a descending channel that had been forming on the daily chart since June 2026.
This Cosmos price prediction is not about whether that breakout happens; it already has. The real question is whether $ATOM can sustain the move above the former resistance or whether fading momentum drags the price back inside the broken structure.
With RSI hovering near the neutral 50 level and long positions absorbing the bulk of recent liquidations, the follow-through over the coming sessions matters more than the breakout itself.
Why ATOM Is at an Important Decision Point
ATOM's market cap sits near $734.55 million, down 1.93% alongside the price pullback, while 24-hour volume has fallen to about $16.28 million, a 24.43% decline that leaves the volume-to-market-cap ratio at 2.21%.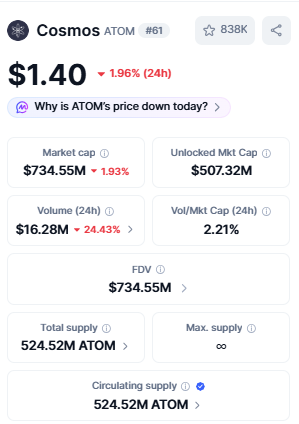
Fully diluted valuation matches the market cap near $734.55 million, with circulating and total supply both close to 524.52 million $ATOM.
The breakout is emerging after an extended corrective period, which is exactly why this Cosmos price prediction treats sustainability, not the initial break, as the central question.
A brief push above resistance means little without the price holding there.
Data source: CoinMarketCap
What Are Futures Traders Signalling?
Long/short data shows a long-biased positioning skew, particularly on Binance. The Binance ATOM/USDT account ratio stands at 1.642; top trader account positioning is higher at 1.8233; and top trader positions sit at 1.8468.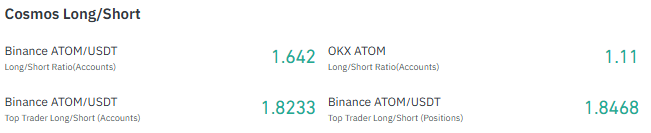
OKX shows a more modest 1.11 tilt toward longs. These ratios describe how accounts are positioned, not a guarantee that the price must continue higher.
Liquidation data adds nuance. Over the past 24 hours, $31.40K in $ATOM positions were liquidated, and $30.73K of that came from longs, with shorts accounting for a negligible $666.56.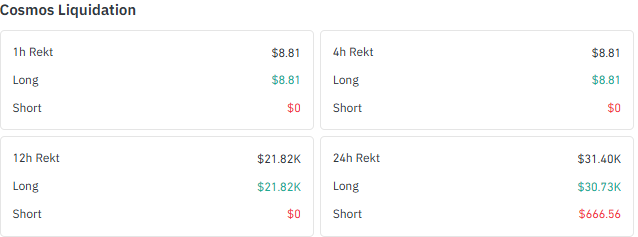
The 12-hour window shows the same one-sided pattern. Traders are positioned toward continuation, but recent weakness is already punishing leveraged longs, and a failed breakout could add to that pressure given how crowded the long side already is.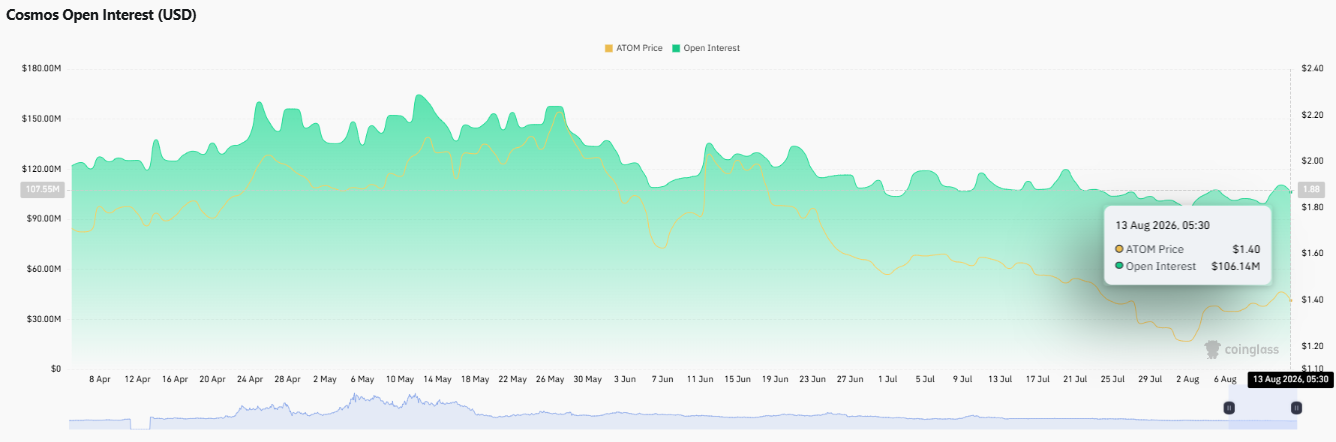
Open interest stands near $106.14 million as $ATOM trades close to $1.40, with derivatives participation recovering alongside the price bounce off the early-August lows.
This does not confirm the breakout on its own, but rising participation does raise the stakes on whether $ATOM can hold above the broken channel, since a failure could pressure a larger pool of leveraged longs.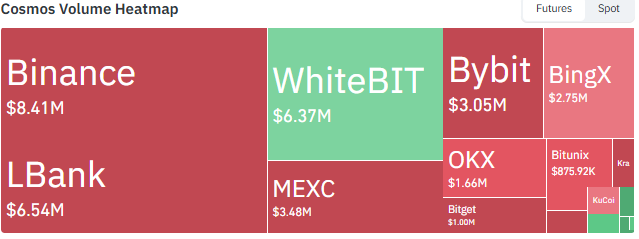
Futures activity is led by Binance near $8.41 million and LBank near $6.54 million, with WhiteBIT also seeing notable volume.
How Has $ATOM Performed Across Timeframes?
$ATOM is down 0.14% over four hours and 2.02% over 24 hours but has gained 3.49% over the past week. That short-term recovery stands in sharp contrast to the medium- and long-term picture.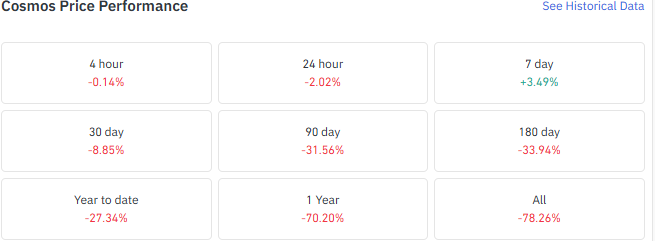
$ATOM remains down 8.85% over 30 days, 31.56% over 90 days, and 33.94% over 180 days, with a 27.34% year-to-date decline and a steep 70.20% drop over the past year.
The broader bearish trend has not reversed, which is what makes the daily channel breakout technically significant after such an extended drawdown.
Data source: Coinglass
Daily Chart: Can ATOM Hold Above the Broken Channel?
The TradingView daily chart shows $ATOM breaking above the upper boundary of a descending channel that developed from the June 2026 decline.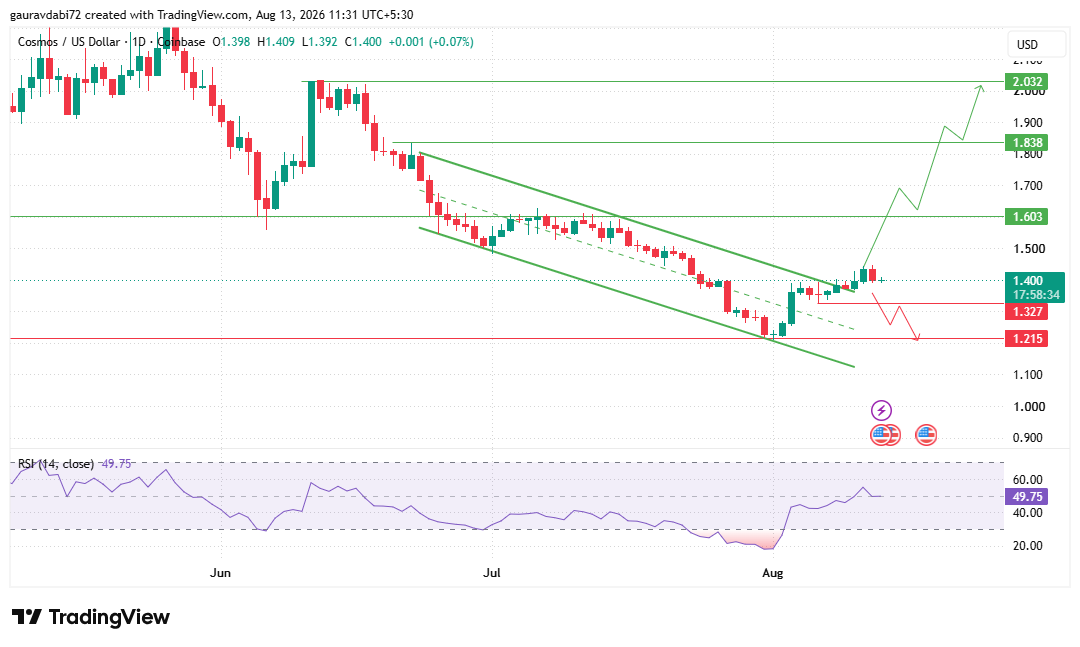
Price is now attempting to hold above that broken structure near $1.40. This is the core of the current $ATOM technical analysis, since sustained follow-through here would carry more weight than the breakout itself.
Daily RSI reads 49.75, a substantial recovery from the oversold region seen around the early-August low and now sitting near the neutral 50 mark.
This reflects genuine momentum recovery, but RSI has not yet established strong bullish momentum, and price breaking its descending structure while RSI still sits near 50 means follow-through remains the key variable to watch.
If $ATOM keeps holding above the former channel resistance and momentum builds, $1.603 becomes the first major resistance, with $1.838 coming into focus only on a sustained move beyond that and $2.032 being relevant only in a much stronger continuation scenario.
If $ATOM instead slips back inside the old channel, $1.327 is the first important support to watch, with $1.215 as the deeper level if selling pressure builds further.
Data source: TradingView
Cosmos Price Prediction: What Comes After the Breakout?
Combining the technical and derivatives picture, this ATOM price forecast comes down to two conditional paths, both of which remain open until price action confirms one side.
Scenario | Key Levels |
Continuation Case | If ATOM continues holding above the broken descending-channel resistance and momentum strengthens, $1.603 becomes the first major resistance. A sustained move beyond that level could bring $1.838 into focus, with $2.032 becoming relevant only if the recovery develops into a much stronger continuation. |
Failure Case | If ATOM fails to hold above the broken descending trendline and moves back inside the former channel, the breakout would lose credibility. $1.327 is the first important support, while $1.215 is the deeper support if selling pressure strengthens. |
Neither path should be treated as the confirmed outcome. The breakout has happened, but its durability has not yet been established.
Can ATOM Turn This Breakout Into a Larger Trend Shift?
As per the Coingabbar analyst, the daily channel breakout is constructive, and the fact that it is developing after such a deep multi-month correction gives it added significance.
Sustained price action above the former resistance, paired with the daily RSI pushing convincingly past 50, would provide stronger evidence that this recovery is turning into something more durable rather than a temporary bounce.
The opposing risk is real. Positioning remains long-biased, long liquidations have dominated the recent data, and open interest is climbing alongside price.
If the breakout fails and ATOM re-enters the old channel, that crowded long positioning could amplify the resulting volatility rather than cushion it.
What We Are Watching Next
Whether ATOM continues holding above the broken Daily channel
Reaction around $1.603
Daily RSI behavior around the 50 level
Whether open interest continues increasing alongside price
Whether long liquidations remain dominant
Any channel re-entry that puts $1.327 back into focus
Disclaimer: This article is for informational purposes only and should not be considered financial or investment advice. Cryptocurrency markets, including Cosmos (ATOM), are highly volatile, and all price levels discussed are conditional technical scenarios, not guarantees. Readers should conduct their own research and consult a qualified financial advisor before making any investment decisions.
0
0

 Manage all your crypto, NFT and DeFi from one place
Securely connect the portfolio you’re using to start.

0
0

0
0

0
0

0
0