Crypto Market Price Analysis Today: Bitcoin (BTC), Ethereum (ETH), Ethereum Name Service (ENS), Lido DAO (LDO), BONK
13d ago•

bullish:
0
bearish:
0
Share

Bitcoin is currently experiencing massive buying demand as it broke above $70K and is aiming for a retest of its ATH. Traders are wondering whether Bitcoin has peaked or if the rally will continue. Analyst “ELI5 of TLDR” mentioned in a post on X that five out of seven on-chain indicators suggest the bull market is just beginning, while two indicate potential topping patterns.
The recent bounce off the psychological support level around $70,000 has sparked buying interest in spot Bitcoin exchange-traded funds. According to Farside Investors, there were about $950 million in inflows last week, marking the best weekly performance since March. If this trend continues, Bitcoin could see a significant upward movement.
Moreover, with the SEC now accelerating to approve the first spot Ethereum ETF in the US, we might see further surges in the coming days. Additionally, will bulls clear the overhead barrier in Bitcoin and retest the lifetime high? Let’s analyze the charts to find out.
Bitcoin (BTC) Price Analysis
Bitcoin has been trading in a bullish range above $70K for the past 24 hours. Such ranges near overhead resistance levels often break to the upside. However, bears continue to defend a surge above Fib channels. As of writing, BTC price trades at $71,169, surging over 6.1% in the last 24 hours.
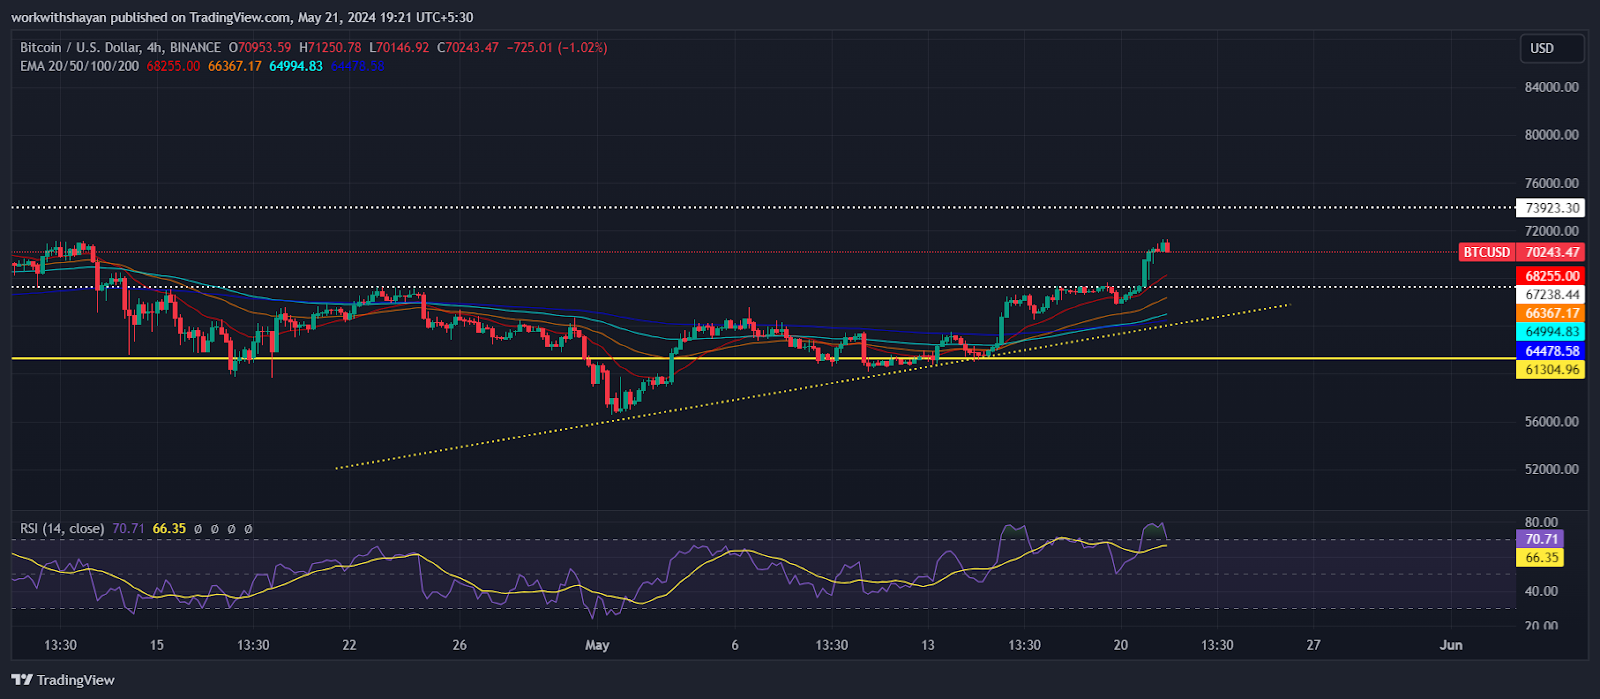
The rising 20-day EMA ($68,324) and the RSI in overbought territory suggest the path of least resistance is upward. If Bitcoin surpasses $74K, the BTC/USDT pair could aim for $80K, where strong selling pressure from bears may emerge.
On the downside, the moving averages are the key support levels to monitor. A break and close below these averages would indicate that the bulls have lost control, potentially causing the pair to drop to $67K and then to $63K.
Ethereum (ETH) Price Analysis
Ether price continues to break above resistance lines as it surged above $3,800 level recently. Buyers are currently in full control of the price chart and are aiming to retest the $4K level. As of writing, ETH price trades at $3,773, surging over 22% in the last 24 hours.
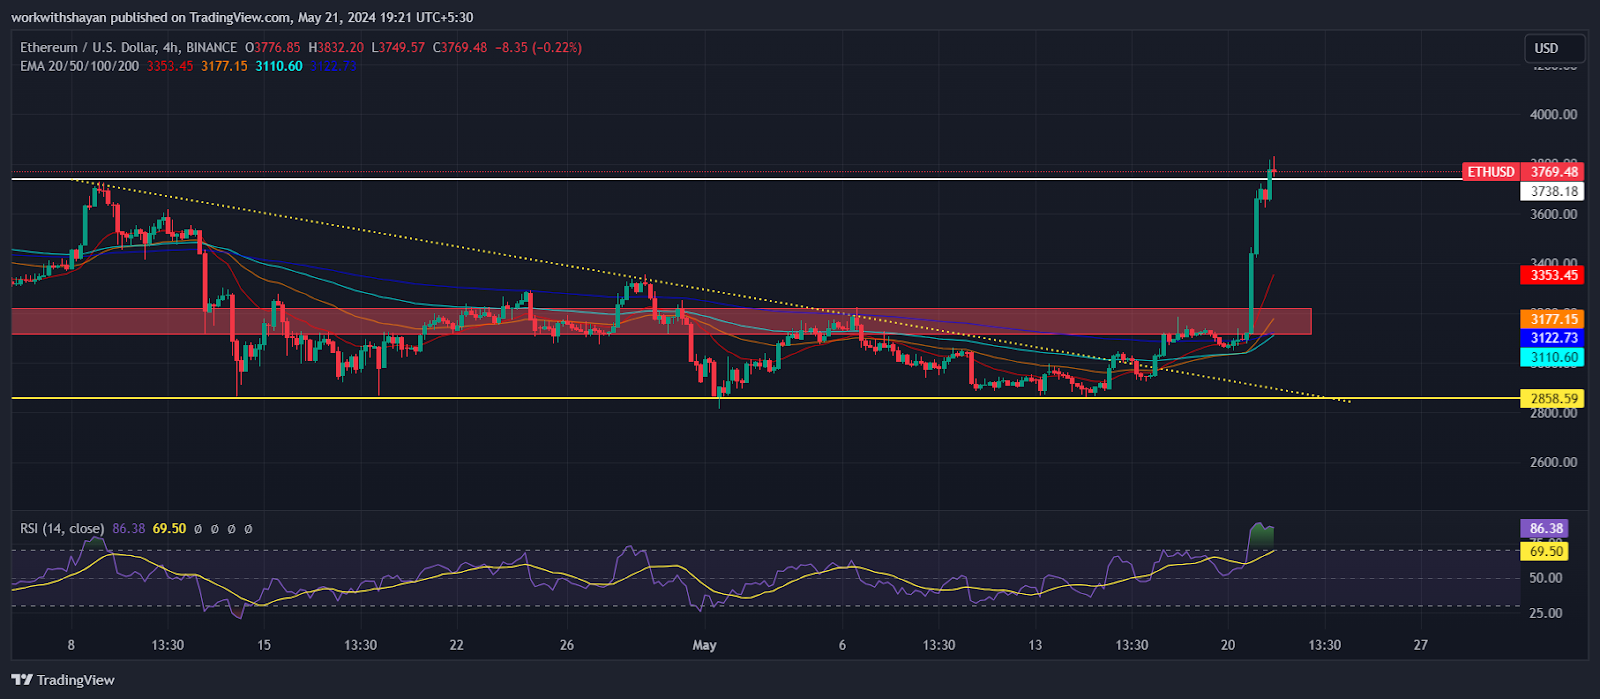
The bulls will attempt again to push the price above the resistance line at $4,100. If successful, this would indicate a potential near-term trend change. The ETH/USDT pair could then rally to $4,500 and potentially challenge buyers’ patience.
To maintain control, the bears need to pull the price below the 20-day EMA and drive the pair below the crucial support at $3,200. This could lead to a decline towards the channel’s support line.
Ethereum Name Service (ENS) Price Analysis
ENS price is steadily approaching the immediate resistance at $23, indicating strong demand from the bulls. Due to a surge in ETH buying demand, ENS price is also skyrocketing above resistance channels. As of writing, ENS price trades at $20.6, surging over 42% in the last 24 hours.
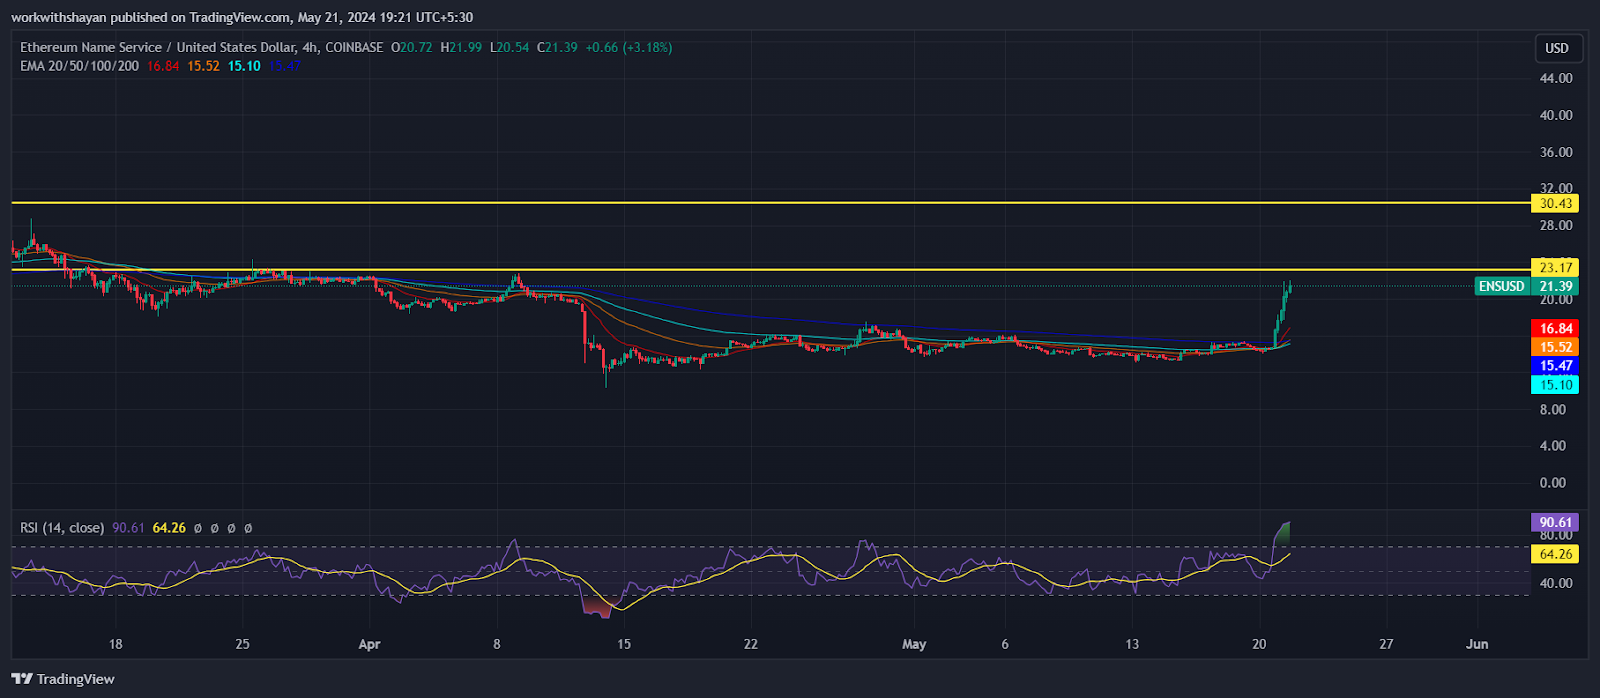
On May 20, the bears attempted to push the price below the level of $14, but the bulls maintained their position. While the $23 level may present a minor obstacle, if the bulls manage to surpass it, the ENS/USDT pair could climb to $30.
However, if the price reverses from the current level or $23 and falls below the moving averages, it will imply that the bears are exerting pressure at higher levels. In this case, the pair might decline toward $10.7.
Lido DAO (LDO) Price Analysis
The bulls have successfully pushed the LDO price above the declining resistance line and are aiming for a breakout above $3.5. As of writing, LDO price trades at $2.3, surging over 35% in the last 24 hours.
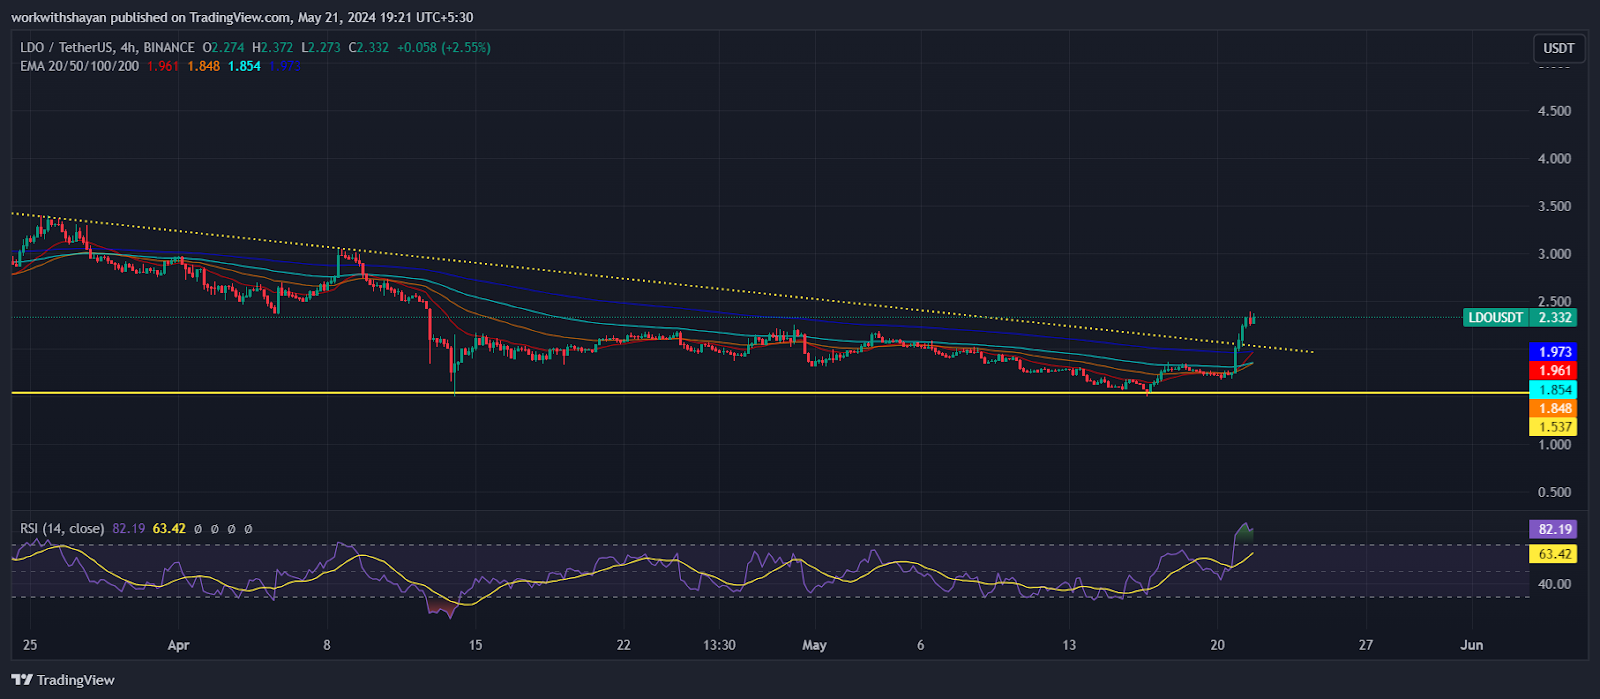
The bears aim to pull the price below the 20-day EMA and test the support line at $1.5; however, bulls are in complete control of the price chart. A continuous surge from the resistance line would imply that the LDO/USDT pair could attempt to break $3.5.
If the price fails to surge above its current level, the bulls will lose confidence, triggering a bearish dominance. This might result in a decline toward $1.5. If bulls fail to defend this level, we might see a drop toward the low of $1. However, a surge above $3.5 might send the price above $4.
Bonk Price Analysis
Bonk price has been trending upwards recently. The bulls managed to push the price above the overhead resistance of $0.000029 and are currently aiming for a move toward $0.000037. Currently, Bonk price trades at $0.00003377, surging over 34% in the last 24 hours.
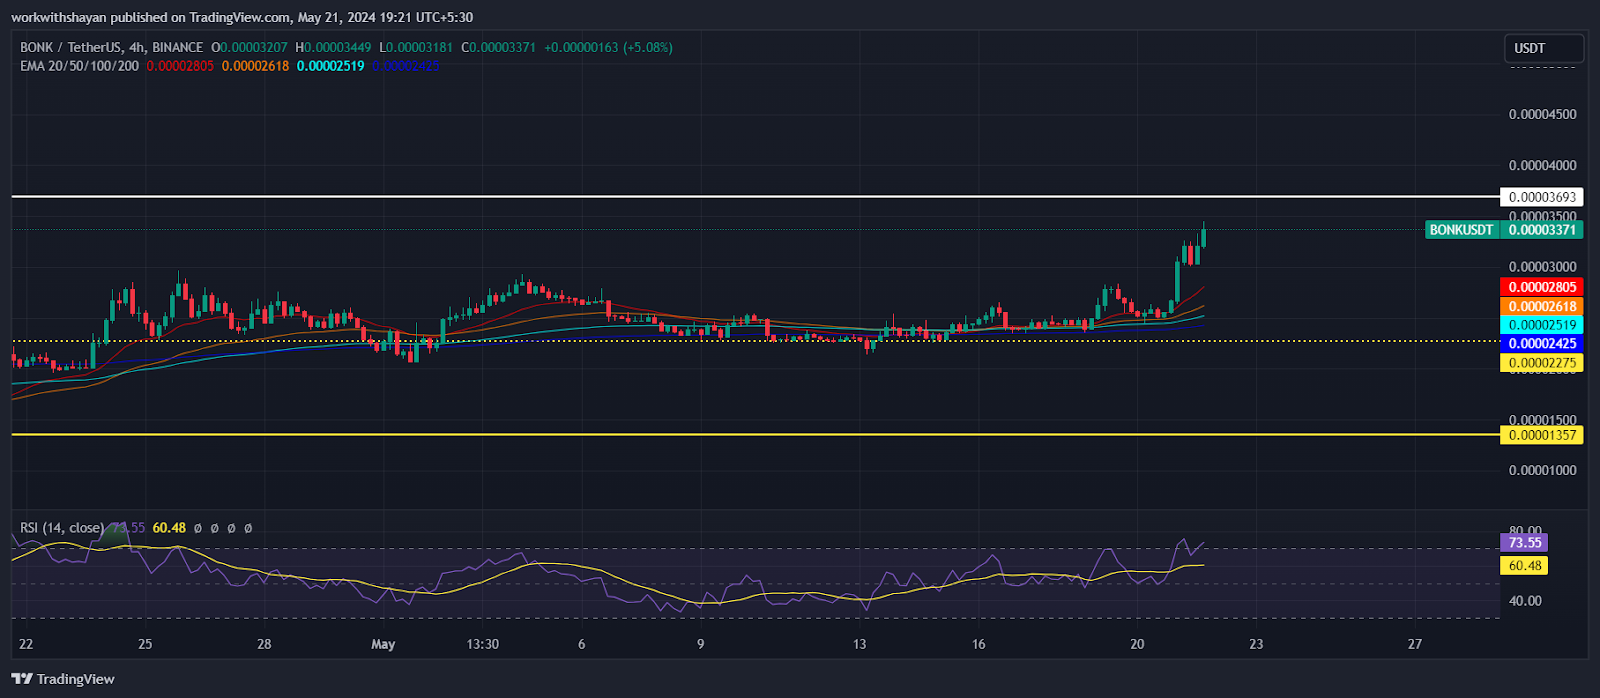
The bulls are now attempting to send the price toward $0.000037. A success in this move might send the price toward $0.00005. However, bears might strongly defend a surge between these levels.
A key level to monitor is the EMA20 trend line. A strong rebound from this level would indicate that bulls are buying on dips, increasing the chances of breaking the psychological resistance at $0.000037.
Conversely, if the price drops sharply and falls below the 20-day EMA, it would suggest that bulls are exiting their positions. This could trigger a correction down to the 50-day SMA at $0.00002275.
On the 4-hour price chart, the RSI level is surging exponentially and it currently trades around 74 level. This currently strengthens the buying demand on the Bonk price chart.
13d ago•
bullish:
0
bearish:
0
Share


 Manage all your crypto, NFT and DeFi from one place
Securely connect the portfolio you’re using to start.

bullish:
0
bearish:
0


