Stellar Price Prediction: XLM Faces Downside Pressure to $0.157 Lows as Bearish Grip Tightens

0
0

Highlights:
- Stellar price has been on the path of downward path, and it is now trading at $0.15 today.
- The derivatives market is experiencing extreme selling pressure, as the open interest is falling as well as the long to short aspect.
- The technical picture shows that the selling grip is high as the indicators of momentum flip negative.
The Stellar (XLM) price is continuing to correct and is trading at $0.157 at the time of writing on Thursday, after being rejected at a major level. The derivatives data exhibit an indication of weakness, and the short bets of XLM have increased as the Open Interest (OI) declines. The crypto market is wobbling, led by Bitcoin, which is closer to $70,000, and Ethereum is nearing $2,000, with both of them registering over 7% losses in the past 24 hours. Technically, the bears are still dominating as they are targeting the lower lows in XLM.
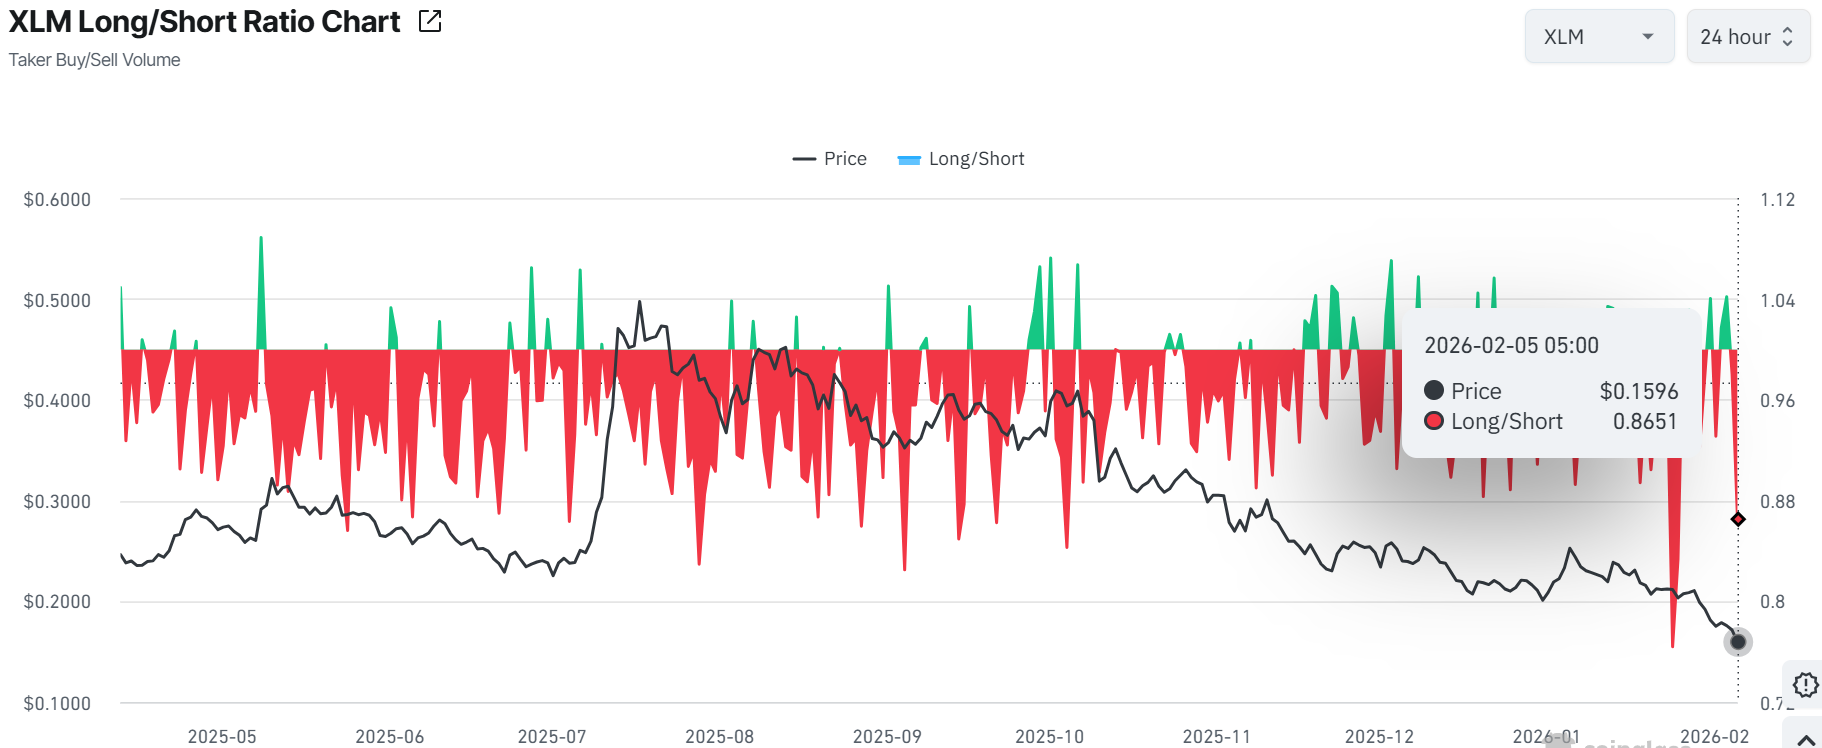
The XLM long-to-short ratio at Coinglass is 0.86 on Thursday, which is almost the lowest in a month. Such a ratio with a value below one indicates a bearish mood in the markets since a greater number of traders are making bets to see the price of the asset decline.
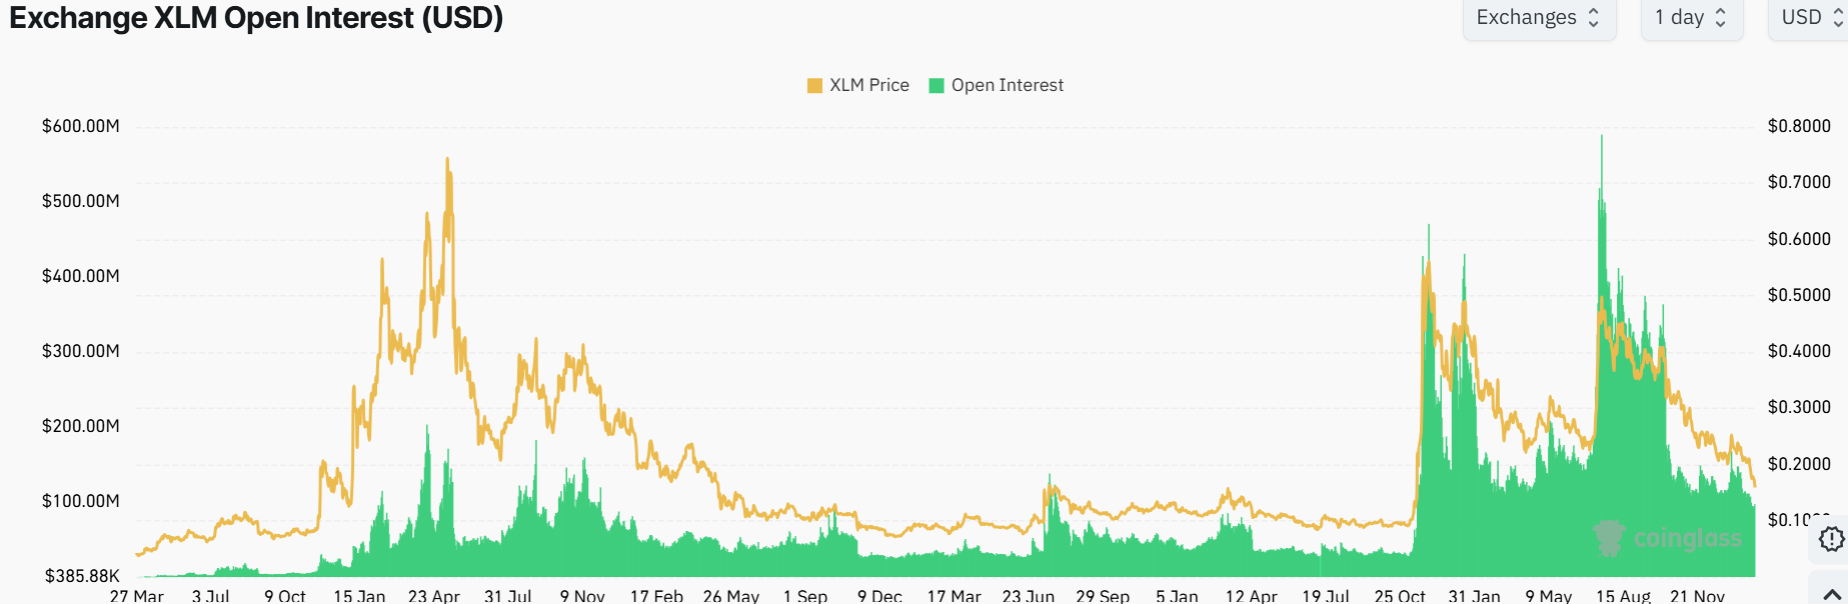
Besides that, the future open interest of Stellar has decreased to $95 million on Thursday, the lowest recorded since November 2024. Moreover, it has been on the decline since the beginning of this year. Such a reduction in OI indicates the declining investor activity and portrays a negative perspective. Further, this shows that money is flowing out of the market, as XLM faces downside pressure.
XLM Faces Downside Pressure As Bears Take Control
The daily XLM/USD chart reveals continued volatility, but also clear zones where price is likely to find support. At present, XLM is exchanging hands around $0.15, as the bears continue dominating the Stellar market. Strong selling pressure is evident, as the XLM price is testing the lower boundary line of the parallel channel, eyeing the $0.157 lows.
There are several critical technical levels to observe. To start with, the immediate support is found between $0.157-$0.160. On the other hand, the key resistance lies in the $0.21-$0.30 band. If the price can rise above $0.21, a move to $0.30 becomes likely, and then possibly $0.35 or even higher.
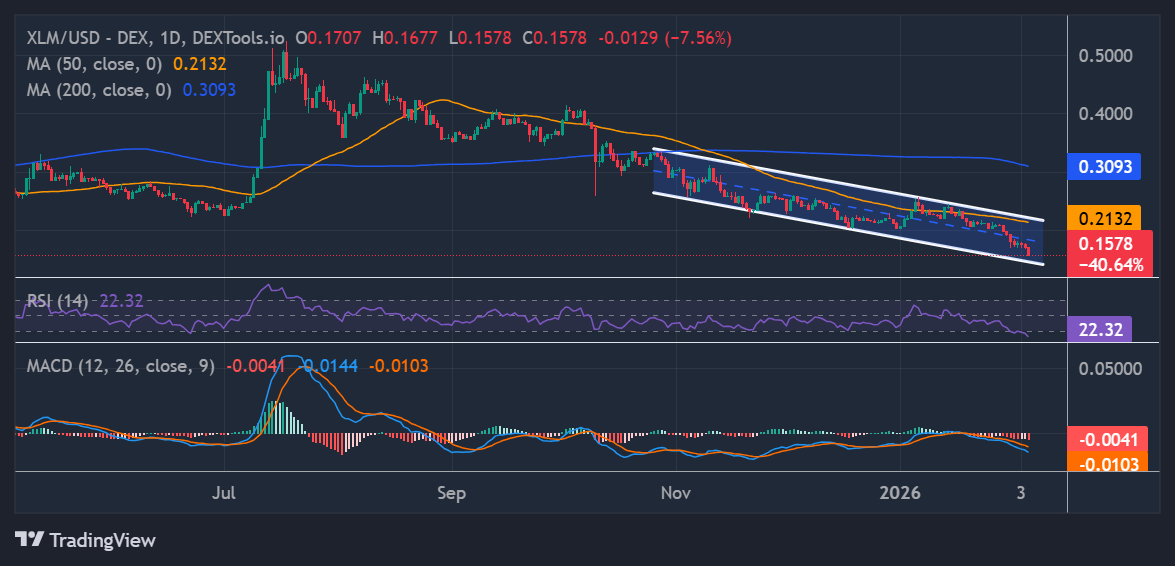
The Relative Strength Index (RSI) shows rapid swings. Recently, RSI was as low as 22.32. This suggests any continued dip could soon reverse upward as traders buy oversold conditions. Notably, the MACD indicator hints at intense selling appetite. With the blue MACD line staying close to the orange signal line, it could mean a sideways phase or mild rebound before any major breakout. But in the meantime, the traders should be cautious as the bearish momentum is mounting.
Meanwhile, if volatility continues and XLM breaks below $0.157, downside risk could emerge to $0.14. But, as long as the price holds above the support zone, the Stellar price could recover and push back toward the $0.21-$0.30 resistance area.
![]()
eToro Platform
Best Crypto Exchange
- Over 90 top cryptos to trade
- Regulated by top-tier entities
- User-friendly trading app
- 30+ million users
![]()
eToro is a multi-asset investment platform. The value of your investments may go up or down. Your capital is at risk. Don’t invest unless you’re prepared to lose all the money you invest. This is a high-risk investment, and you should not expect to be protected if something goes wrong.
0
0

 Manage all your crypto, NFT and DeFi from one place
Securely connect the portfolio you’re using to start.

0
0

0
0

0
0

0
0