
Arbitrum price prediction 2026-2032: Will ARB reach $1?

0
0

Key takeaways:
- Our ARB predictions anticipate a high of $0.31 in 2026.
- In 2028, the range is expected to be between $0.61 and $0.74, with an average price of $0.63.
- In 2030, it will range between $1.24 and $1.52, with an average price of $1.28.
Arbitrum price prediction points to a modest near-term outlook and a stronger long-term move: our ARB forecast sees a high of $0.31 in 2026, with the token potentially reaching between $1.24 and $1.52 by 2030 and averaging $1.28, which suggests it could reclaim and move past $1 by the end of the decade.
Layer 2s have generated considerable buzz for their efficiency, and the Arbitrum network is in the top 5 pack, with a total value locked (TVL) of $1.24 billion. Arbitrum is an Optimistic Rollup solution that shifts network operations off the Ethereum mainnet while maintaining Ethereum-level security, keeping ARB relevant to investors tracking Ethereum scaling adoption and long-term token demand.
For crypto investors, traders, and enthusiasts weighing ARB’s upside, this analysis examines Arbitrum’s current price action, technical indicators, market trends, competition, historical sentiment, recent news, and the key factors shaping its forecasts from 2026 to 2032. Is Arbitrum a good investment? Will it go up? Where will it be in 5 years? Let’s answer those questions with a data-driven Arbitrum price prediction to help you make more informed decisions in a volatile market.
Overview
| Cryptocurrency | Arbitrum |
| Abbreviation | ARB |
| Market cap | $1.47B |
| Trading volume | $835M |
| Circulating supply | 6.67B |
| All-time high | $2.40 on Jan 12, 2024 |
| All-time low | $0.07067 on Jun 26, 2026 |
| 24-hour high | $0.2274 |
| 24-hour low | $0.1719 |
Arbitrum price prediction: Technical analysis
| Metric | Value |
| Volatility (30-day variation) | 25.66% (Extremely High) |
| 50-day SMA | $0.1060 |
| 200-day SMA | $0.1014 |
| Sentiment | Bullish |
| Green days | 17/30 (57%) |
| Fear and Greed Index | 56 (Greed) |
Arbitrum price analysis
On September 18, Arbitrum’s price rose 25.68% over 24 hours and 167.33% over 30 days. The bull run reflected recent ARB price action and was accompanied by a rise in trading volume (89%). Broader crypto market conditions and ETH prices can shape short-term sentiment, and recent strength across Ethereum Layer 2 networks, including rising TVL, has also weighed on ARB sentiment as the market shifts.
ARB 1-day chart analysis
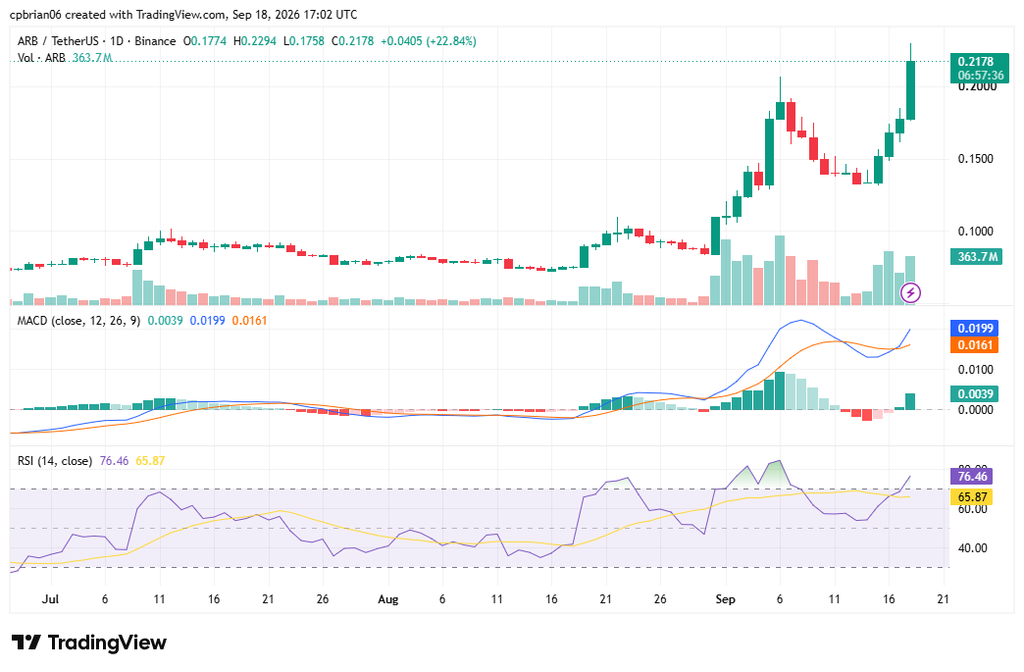
ARB trades upwards, reflecting a short-term bullish trend. The run tracked the broader altcoin rally, driven by capital rotation into the sector, as reflected in a rising Altcoin Season Index. It also reflects ARB’s rally from a prolonged consolidation. ARB now has support at $0.13, with nearby resistance levels above the current range, one of the chart’s highest levels watched by short-term traders.
Arbitrum price 4-hour chart analysis
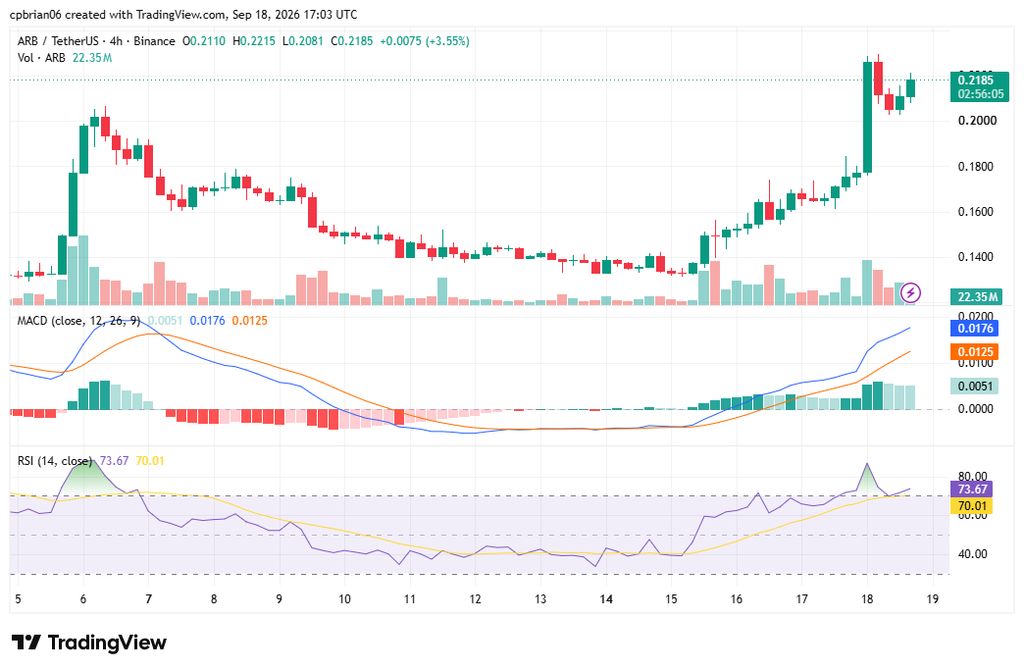
ARB registered a new all-time low (ATL) of $0.071 in June. The chart highlights ARB’s correction and breakout from $0.12 support. Its Relative Strength Index is now at 73.67, in overbought territory. A correction from here would depend on more recent prices holding below resistance, while short-term EMAs suggest a bullish market.
Arbitrum technical indicators: Levels and action
Daily simple moving average (SMA)
| Period | Value ($) | Action |
| SMA 3 | 0.1658 | BUY |
| SMA 5 | 0.1528 | BUY |
| SMA 10 | 0.1498 | BUY |
| SMA 21 | 0.1383 | BUY |
| SMA 50 | 0.1060 | BUY |
| SMA 100 | 0.09435 | BUY |
| SMA 200 | 0.1014 | BUY |
Daily exponential moving average (EMA)
Exponential moving averages place more weight on recent prices than the SMA, which enables faster reaction to trend changes.
| Period | Value ($) | Action |
| EMA 3 | 0.1666 | BUY |
| EMA 5 | 0.1600 | BUY |
| EMA 10 | 0.1525 | BUY |
| EMA 21 | 0.1394 | BUY |
| EMA 50 | 0.1179 | BUY |
| EMA 100 | 0.1078 | BUY |
| EMA 200 | 0.1264 | BUY |
What to expect from the ARB price analysis next?
Arbitrum’s near-term outlook is bullish; shorter timeframes support a reversal from overbought territory.
Does Arbitrum have a future?
As a Layer-2 scaling solution for the Ethereum network, Arbitrum uses optimistic rollups to process transactions off-chain and submit proofs back to Ethereum, helping improve Ethereum’s scalability. High adoption is crucial to Arbitrum’s long-term success and sustainability. Ongoing token release schedules create continuous dilution risk for the asset. It also faces intense competition from other Ethereum Layer-2s like Optimism and zkSync; Optimism is pushing a Superchain strategy, while zkSync and StarkNet offer faster finalization than Arbitrum. Future performance also depends on whether governance activity and adoption improve value capture relative to network activity.
Recent news
Standard Chartered’s research arm initiated coverage of ARB with a $10 price target for 2030 and a $0.50 target for end-2026. The report highlighted Arbitrum’s revenue-sharing model, estimating September fees at $5 million—a 5x increase driven by the Robinhood Chain launch in July.
ARB price prediction September 2026
The Arbitrum price forecast for August is estimated to range from $0.0750 to $0.1001, and this monthly outlook is one of several short-term price predictions investors may track. The average price for the month will be $0.0809.
| Month | Potential low ($) | Potential average ($) | Potential high ($) |
| September | 0.0750 | 0.0809 | 0.1001 |
Arbitrum price prediction 2026
For 2026, ARB’s price will range from $0.06 to $0.31. The average price for the period will be $0.21. Other market analysis projects 2026 between $0.08574 and $0.251, with an average of $0.1683.
| Year | Potential low ($) | Potential average ($) | Potential high ($) |
| 2026 | 0.0608 | 0.2122 | 0.3109 |
Arbitrum price prediction 2027-2032
| Year | Potential low ($) | Potential average ($) | Potential high ($) |
| 2027 | 0.4207 | 0.4364 | 0.5134 |
| 2028 | 0.6123 | 0.6341 | 0.7447 |
| 2029 | 0.8807 | 0.9124 | 1.06 |
| 2030 | 1.24 | 1.28 | 1.52 |
| 2031 | 1.73 | 1.78 | 2.10 |
| 2032 | 2.55 | 2.64 | 3.00 |
Arbitrum price prediction 2027
Arbitrum market price prediction climbs even higher into 2027. Some external forecasts place ARB’s price in a much more bullish $5.00 to $8.00 range across 2027-2028. Some crypto analysts place 2027 in a wider comparative range of $0.157 to $0.446, with an average near $0.3015. According to Arbitrum’s price forecast, ARB’s price will range from $0.42 to $0.51, with an average of $0.44.
Arbitrum coin price prediction 2028
Our analysis indicates a further acceleration in ARB’s price. It will trade between $0.61 and $0.74 and an average price of $0.63.
Arbitrum price prediction 2029
According to the 2029 Arbitrum forecast, ARB’s price will range from $0.88 to $1.06, with an average of $0.91.
ARB price prediction 2030
The ARB price prediction for 2030 is $1.24-$1.52, with an average of $1.28. Broader 2030 projections place ARB between $2.46 and $5.78, with an average of $4.12. In a bullish scenario, some forecasts extend toward $12.00, though the long-term impact depends on several factors, including on-chain metrics, market conditions, Layer-2 adoption, Ethereum scaling upgrades, TVL, and competition.
Arbitrum price prediction 2031
The Arbitrum price forecast for 2031 is a high of $2.10. It will reach a minimum price of $1.73 and an average price of $1.78.
Arbitrum ARB price prediction 2032
The year 2032 will also be bullish. Our analysis estimates a price range of $2.55 to $3.00, with an average price of $2.64. A conservative model suggests ARB could be around $0.13 by 2036 and $0.26 by 2051.

ARB market price prediction: Analysts’ ARB price forecast
This table compares analysts’ market analyses of Arbitrum’s price across leading platforms and serves as a simple price-prediction tool for reviewing external analysts’ forecasts.
| Platform | 2026 | 2027 | 2028 |
| Coincodex | $0.06006 | $0.1173 | $0.1063 |
| Gate.com | $0.07913 | $0.08506 | $0.1003 |
Cryptopolitan’s ARB price prediction
Cryptopolitan’s Arbitrum price forecast indicates that ARB will reach a high of $0.31 in 2026, and whether it’s a good buy depends on your risk tolerance and time horizon. At its current price below $1, ARB would need a 1000% surge to reach $10. Any path there faces potential short-term constraints from supply growth and market sentiment, so it would likely take several years even in favorable conditions. Since its launch, ARB has peaked at $2.40, so a $10 target at the current price level seems highly implausible. In 2028, the range is expected to be between $0.61 and $0.74, with an average of $0.63. In 2030, the range is likely to be between $1.24 and $1.52, with an average of $1.28. ARB can be treated as a high-risk asset and should make up only a small percentage of a diversified portfolio. This content is for informational purposes only, not investment advice; do your own research and invest at your own risk.
Arbitrum historic price sentiment

- The Arbitrum airdrop snapshot occurred on Feb 6, 2023, and eligible participants, including early users, started claiming ARB tokens on Mar 23, 2023. The claiming period ended on September 24, 2023.
- The airdrop granted 11.5% of the total supply to eligible users, 1.1% to DAOs operating in the Arbitrum ecosystem, and 44% to employees and Offchain Labs investors. The 44% is subject to lock-up periods and a vesting schedule, while whales control 57.13% of the supply, which can influence price movements when large holders reposition. The rest was sent to the Arbitrum DAO treasury.
- ARB is the native token of the network, with a total supply capped at 10 billion, annual inflation of 2%, and 12.75% of the supply initially distributed to eligible users and DAOs. ARB holders use it as a governance token to vote on protocol upgrades rather than to pay gas.
- A significant share of supply remains locked and is released gradually into circulation, potentially creating selling pressure if demand does not keep pace, and ongoing token release schedules can aalso dd continuous dilution risk over time.
- On Sep 11, 2023, it fell to its all-time low at $0.7453.
- Bitcoin’s halving and the hype around crypto ETFs helped the coin recover from its October slump. By the end of the year, it had risen to $1.4.
- The run continued into 2024. On Jan 12, it reached its all-time high at $2.40.
- According to CoinMarketCap data, ARB fell below its listing price in June 2024.
- On August 5, 2024, it registered a new all-time low of $0.4317
- It then recovered in September, reaching a high of $0.67.
- The bullish run continued into November, reaching $1.12 in December.
- The Arbitrum network includes Arbitrum One for dApps that need stronger security and Arbitrum Nova for high-throughput use cases such as gaming and social apps; for example, this structure lets more security-sensitive DeFi apps stay on One while lighter social activity can run on Nova. It has processed billions of transactions with high user participation and millions of daily users. Some estimates also place total value locked in the $16-$20 billion range, underscoring the strength of its DeFi ecosystem and its ongoing expansion. Offchain Labs, whose leadership includes co-founder Steven Goldfeder, helped develop this broader ecosystem structure.
- The coin entered 2025 trading at $0.72 before entering a bear run, falling to a low of $0.40 in February.
- It recovered later and crossed into October, trading at $0.45. The trend later reversed, and by date 11, it had fallen to $0.136.
- In December, it traded at $0.20.
- ARB then entered a bear market in 2026 and, on Mar 30, 2026, hit an all-time low of $0.08653.
- It later began to recover, and by May it had crossed above $0.12. The trend reversed in June, with the price trading at $0.08. It maintained the level into August.
- In September, ARB broke out to the upside, reaching a high of $0.19 after a long consolidation and gaining over 100%.
- Competition from other blockchain projects remains a key factor for ARB, with Arbitrum facing rivals such as Optimism, zkSync, and Ethereum L2S like Base.
0
0

 Manage all your crypto, NFT and DeFi from one place
Securely connect the portfolio you’re using to start.


