Cardano Price Analysis: ADA Breaks $0.25 Resistance as Analysts Predict a Strong Bullrun

0
0
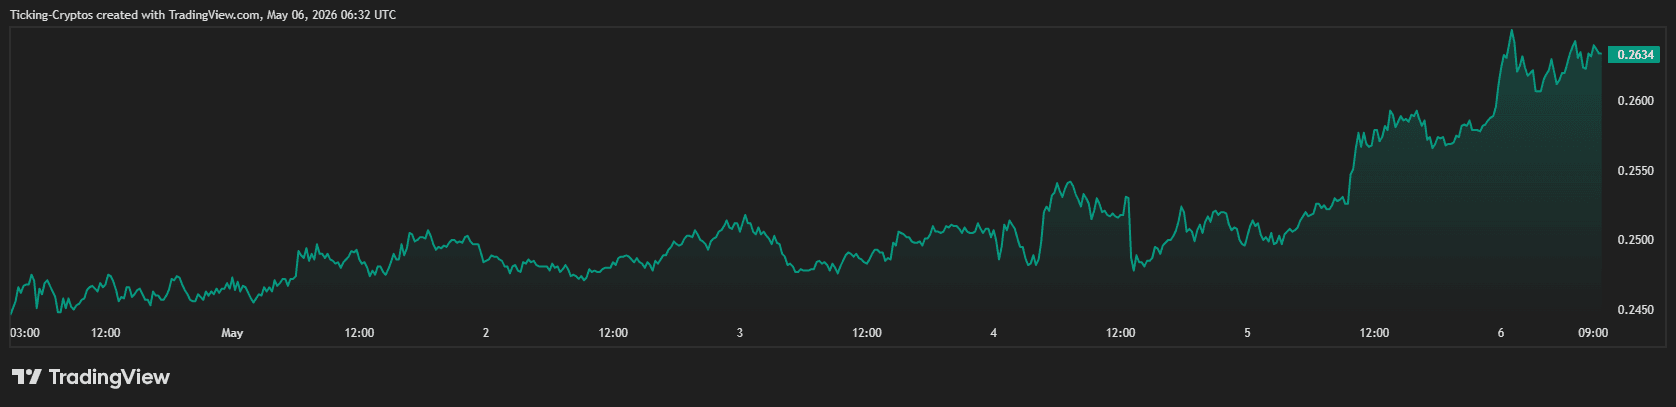
After weeks of stagnant price action and tight consolidation, ADA reclaimed the $0.25 psychological level. As of May 6, 2026, ADA is trading at $0.263. Is this a breakout or a simple price action in a consolidation zone?
Has the ADA Coin Bullrun Started?
The current jump to $0.263 serves as a confirmation of a trend reversal. For the past month, $ADA struggled to overcome selling pressure at the $0.25 mark. By clearing this resistance with a strong 5.7% daily candle, the market has signaled a shift in dominance from sellers to buyers. Analysts are now eyeing the $0.30 mark as the next logical milestone, citing improved on-chain activity and a favorable macroeconomic environment for $Bitcoin and major altcoins.
Resistance Flips and Market Sentiment
In technical analysis, a resistance level is a price point where an asset faces significant selling pressure. When ADA "breaks" $0.25, it effectively exhausts the supply of sellers at that level. Ideally, this level will now act as support, meaning if the price dips, buyers are expected to step in at $0.25 to prevent further decline. This "S/R Flip" is often the foundation of a sustained bullrun.
Cardano Price Analysis: Is the ADA Bullrun Starting?
Based on the latest data for ADA/USD on the daily (1D) timeframe, several indicators confirm the strength of this move.
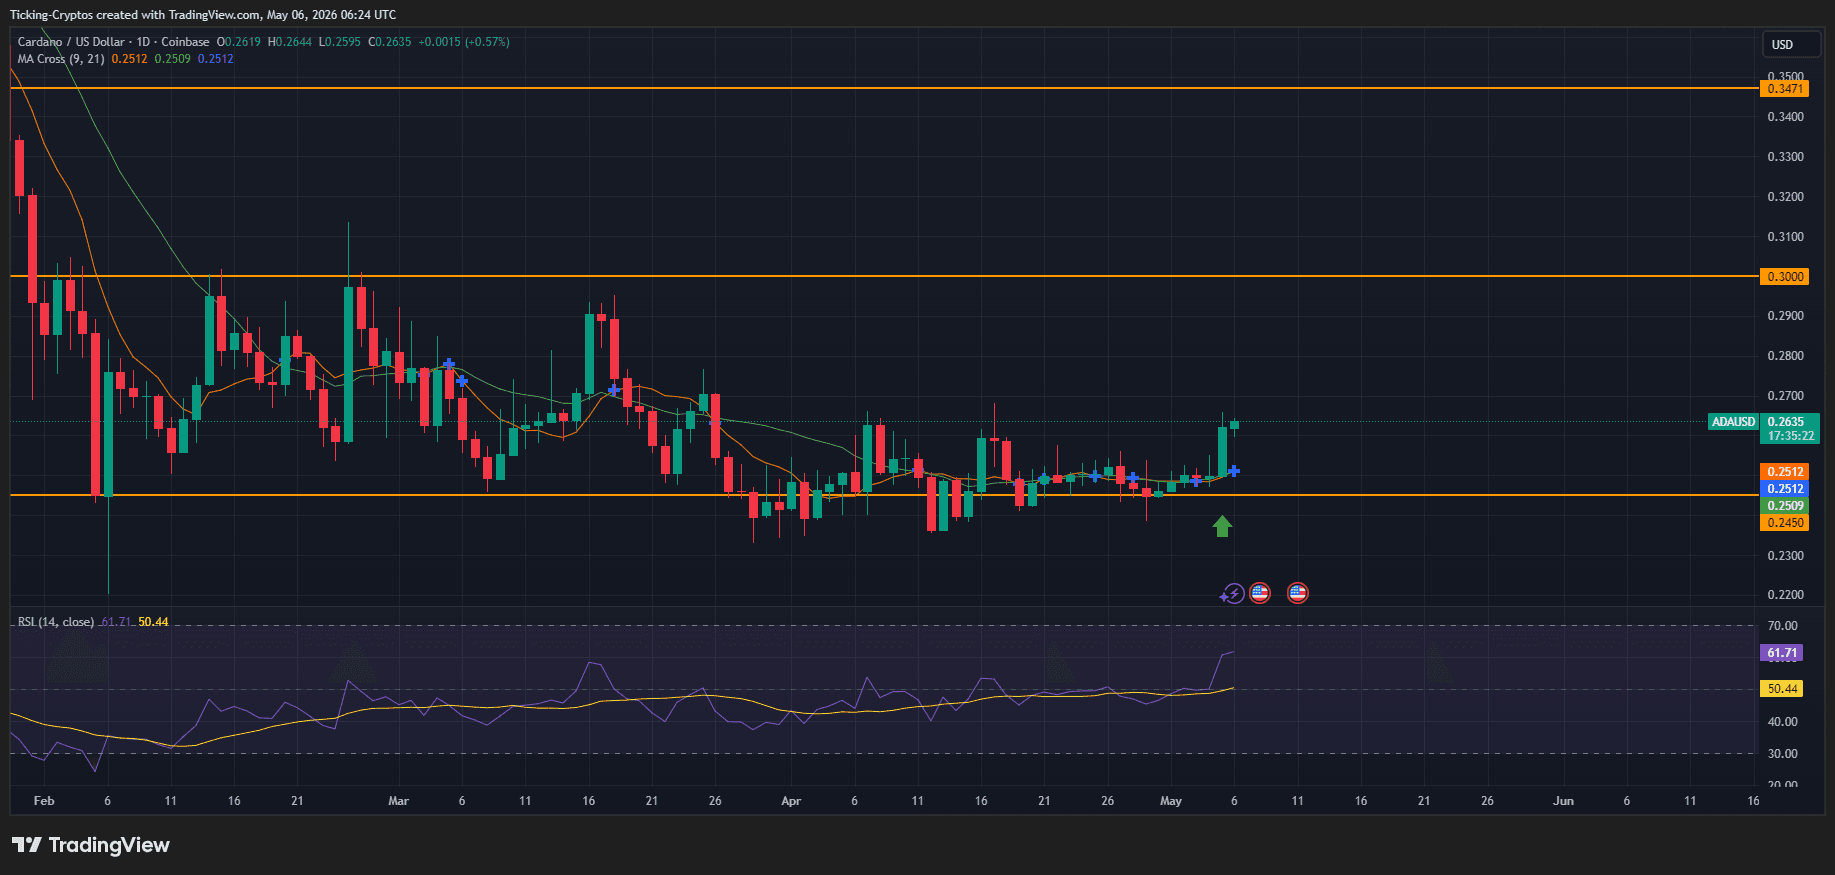
1. The $0.25 Breakout Support
The chart identifies a critical orange horizontal line at $0.2509. ADA spent the latter half of April testing this boundary. The green arrow on the chart highlights the successful breakout, where the price accelerated toward $0.2635. This breakout was accompanied by a noticeable increase in buying volume.
2. Moving Average Convergence
The 9-day and 21-day Moving Averages (MA) have just completed a bullish crossover:
- MA (9): 0.2512
- MA (21): 0.2509
With the price now trading comfortably above both averages, the short-term trend is firmly upward. This alignment is a classic signal used by swing traders to enter long positions.
3. RSI Momentum
The Relative Strength Index (RSI) is currently at 61.71. This indicates that while momentum is strong, the asset is not yet "overbought" (which typically occurs above 70). This suggests there is still significant "gas in the tank" for ADA to reach higher price targets before a major cooling-off period is required.
Cardano Key Price Levels to Watch
| Level Type | Price Point | Significance |
|---|---|---|
| Immediate Support | $0.251 | The "Line in the Sand" that must hold to maintain bullish bias. |
| Current Price | $0.263 | The active breakout zone. |
| Target Resistance 1 | $0.300 | A major psychological barrier for the mid-term. |
| Target Resistance 2 | $0.347 | The high-water mark that would confirm a full-scale bullrun. |
What Factors will Contribute to a Cardano Bullrun?
Beyond the charts, Cardano's fundamental landscape is evolving. Cardano's Total Value Locked (TVL) in DeFi protocols has seen a 12% increase over the last quarter. The market is also reacting to the progress of the Ouroboros Leios upgrade, which aims to drastically increase the network's transaction-per-second (TPS) capacity.
As the network becomes more scalable, the demand for ADA for gas fees and staking increases. Traders are increasingly comparing Cardano's performance to other Layer 1s in our exchange comparison to determine if it is undervalued relative to its peers.
0
0

 Manage all your crypto, NFT and DeFi from one place
Securely connect the portfolio you’re using to start.

0
0


