
Zcash Price Prediction: $ZEC Hits 8-Year High, Traders Eye $1,100+

0
0

Zcash just smashed through an eight-year high, and crypto Twitter is on fire.
Grayscale's ETF filing lit the fuse, "ZEC to $1K" calls are flooding timelines, and even Ray Dalio's old Bitcoin-privacy jab is getting dragged back in to build the bull case for ZEC.
This Zcash Price Prediction checks whether this FOMO has real legs or if latecomers are chasing a top nobody wants to admit is forming.
Market data was checked on August 24, 2026, at 09:44 IST.
Zcash Price Prediction Today: Market Overview
| Metric | Value |
| Price | $831.01 |
| 24h Change | +6.87% |
| Market Cap | $14B (+6.87%) |
| FDV | $17.47B |
| 24h Volume | $1.59B (-24.88%) |
| Vol/Mkt Cap (24h) | 11.38% |
| Total Supply | 16.83M $ZEC |
| Max Supply | 21M ZEC |
| Circulating Supply | 16.83M $ZEC |
Source: Data from CoinMarketCap as of August 24, 2026, at 09:44 IST. Figures may vary slightly across other tracking websites.
ZEC crypto news today: Grayscale 8-Year High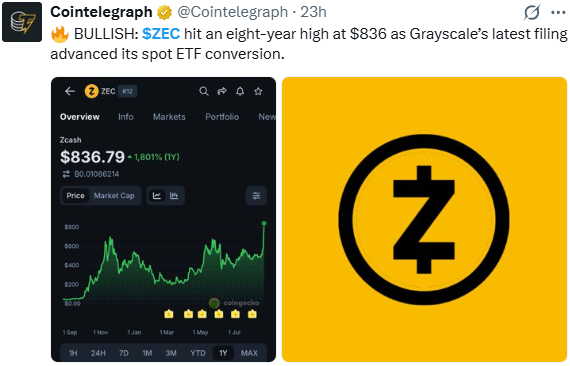
Source: Data From X
Cointelegraph reported the move directly: $ZEC touched an eight-year high near $836 after Grayscale's latest filing advanced its spot ETF conversion.
That single headline is doing most of the heavy lifting behind today's rally, and it's why "Zcash ETF" is trending across crypto social media right now.
$Zcash ETF News: Traders Point to Ray Dalio as the Next Big $ZEC Buyer
Trader Taiki Maeda posted that he's "extremely bullish" on a $Zcash ETF, arguing that macro allocators like Ray Dalio, who has publicly raised concerns about Bitcoin lacking privacy and facing quantum computing risk, according to a video shared by TFTC, could become natural buyers of a privacy-focused asset like $ZEC instead.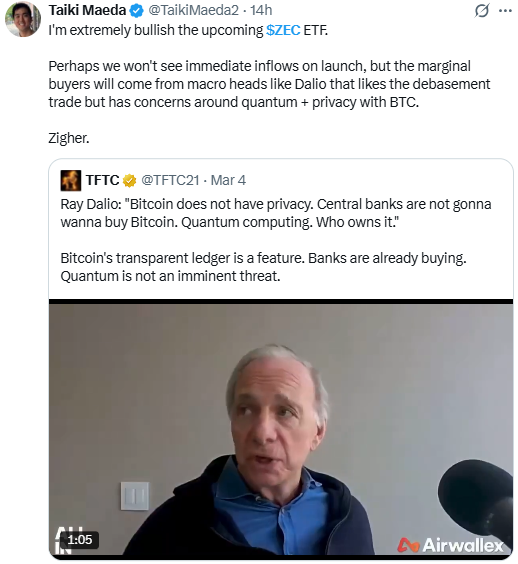
Note: This is Maeda's personal read on the setup, not confirmed guidance from Dalio himself, and CoinGabbar could not independently verify any planned allocation toward ZEC or Zcash-linked products.
Zcash Price Prediction Chart: Technical Analysis
Pair: ZEC/USDT · Market: Spot (Crypto) · Exchange: OKX · Timeframe: 1D · Source: TradingView · Timestamp: August 24, 2026, 09:44 UTC+5:30
ZEC broke above a long descending trendline that had capped the price since earlier this year, then broke higher in a sharp daily-candle rally.
A confirmed close above $889.56 opens the path toward the $1,128.63 Fibonacci extension.
Losing $766.53 would put the breakout structure in doubt, with $701.13 as the next level down.
Price is now trading at $831.01, Both EMAs sit well below the current price, with EMA 20 at $608.44 and EMA 50 at $543.01, confirming just how stretched this move already is.
RSI is reading 83.24, deep in overbought territory, which often precedes a pullback or a period of sideways digestion before the next leg.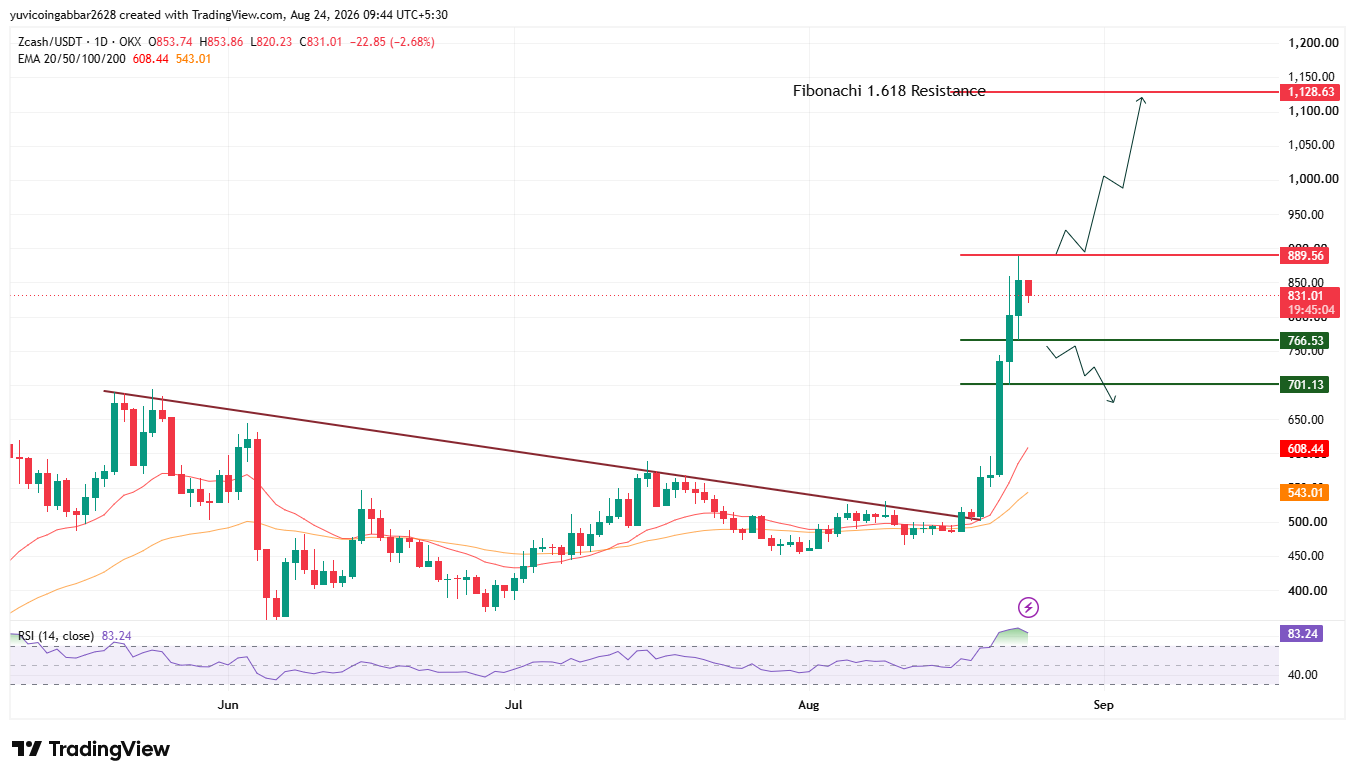
Zcash Price Prediction: Support and Resistance Levels
| Level Type | Price |
| Resistance 2 (Fibonacci 1.618) | $1,128.63 |
| Resistance 1 (nearest) | $889.56 |
| Immediate Price Reference | $831.01 |
| First Support | $766.53 |
| Deeper Support | $701.13 |
Zcash Forecast: Bull Case vs Bear Case
$ZEC price target 2026 Bull case: Holding above $766.53 keeps the breakout intact through this cooldown. A close above $889.56 opens the path toward $1,128.63.
$ZEC price target 2026 Bear case: RSI above 83 leaves ZEC exposed to a sharp pullback. Losing $766.53 puts the rally in doubt, with $701.13 as the next level down.
$ZEC price target: Can $ZEC Reach $1,128.63?
$1,128.63 is the highest resistance on the chart.
Getting there needs $ZEC to hold $766.53 through the current cooldown, then clear $889.56 with fresh volume a multi-step move, not a straight shot.
$Zcash Price Prediction: Expert View
According to CoinGabbar analysts , $ZEC's move is being driven almost entirely by the Grayscale ETF narrative rather than by chart structure alone, and an RSI above 83 means this rally is running hot.
The $766.53 to $889.56 range is the zone to watch: holding above $766.53 keeps the breakout thesis alive even through a cooldown, while a clean break above $889.56 would open real room toward the $1,128.63 Fibonacci target.
Given how far price has already run above both EMAs, a sharp pullback before any fresh leg higher wouldn't be surprising.
Disclaimer: This piece is for informational purposes only and isn't financial advice. The levels and scenarios above are based on technical chart analysis and publicly available data at the time of writing, and crypto markets can move sharply within hours, so past patterns don't guarantee future outcomes. It's worth doing independent research and considering your own risk tolerance before acting on any of the levels discussed here.
0
0

 Manage all your crypto, NFT and DeFi from one place
Securely connect the portfolio you’re using to start.


