Bitcoin ETFs Cement 4 Weeks of Outflows: Next Stage for BTC Is Here

0
0
Bitcoin BTC $85 821 24h volatility: 0.3% Market cap: $1.71 T Vol. 24h: $69.93 B spot ETFs recorded another tough week with $1.22 billion weekly outflow between Nov. 17 to Nov. 21. Across the past month, these funds posted a total outflow of $4.349 billion, the second-largest four-week slide on record.
The only larger Bitcoin ETF selling wave happened from mid-February to mid-March, when $4.806 billion exited, according to SoSoValue.
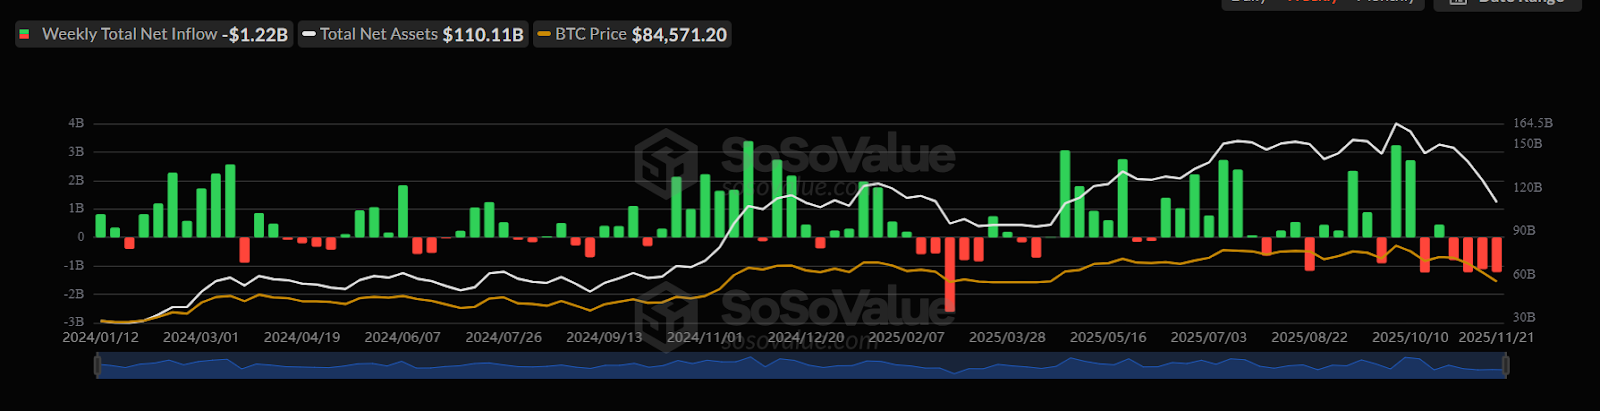
Bitcoin spot ETF weekly inflow | Source: SoSoValue
NYDIG head of research Greg Cipolaro noted that ETF inflows and digital asset treasury demand largely influenced the past cycle. He added that a heavy selling event in early October flipped ETF inflows into outflows and dragged down stablecoin supply.
He explained that the largest cryptocurrency is also guided by broader forces such as global money trends, market fragility, and trader behavior.
After dropping to the $82,000 zone over the weekend, BTC has drawn fresh interest. The cryptocurrency is currently trading around $87,221 with a 1.8% daily gain, but it is down 21% over the past month.
Despite price pullback and massive ETF inflows, Bitcoin’s total market dominance sits near 59% as of writing. During market pullbacks, traders often rotate their funds from altcoins into BTC.
Market Pressure Eases as Traders Look for a Base
The market is eyeing a year-end rally as analysts say Bitcoin may be taking its “first real step” toward forming a base. The Risk-Off Signal, which tracks waves of selling, is pulling back quickly.
The last time such a massive sell-off wave pattern showed up, BTC later climbed 47% to a new peak.
According to Swissblock analysts, this drop in the Risk-Off signal hints that selling pressure is easing and the worst phase is over for now. They added that this week would be important for traders to monitor selling behavior.
Bitcoin has taken its first real step toward forming a bottom.
The Risk-Off Signal is dropping sharply, which tells us two things: selling pressure has eased, and the worst of the capitulation is likely behind us, for now. 👇https://t.co/Y2JTyqD93f pic.twitter.com/zjfkmVwCru
— Swissblock (@swissblock__) November 24, 2025
In many past cycles, a second but smaller wave of sales often marked buyers regaining control. This suggests that BTC could see consolidation in the near-term with prices holding recent lows.
Sideways Movement for BTC?
Meanwhile, long-term holder wallet flows show heavy selling from older crypto wallets. This pattern often takes place during strong market phases when early investors decide to lock in gains.
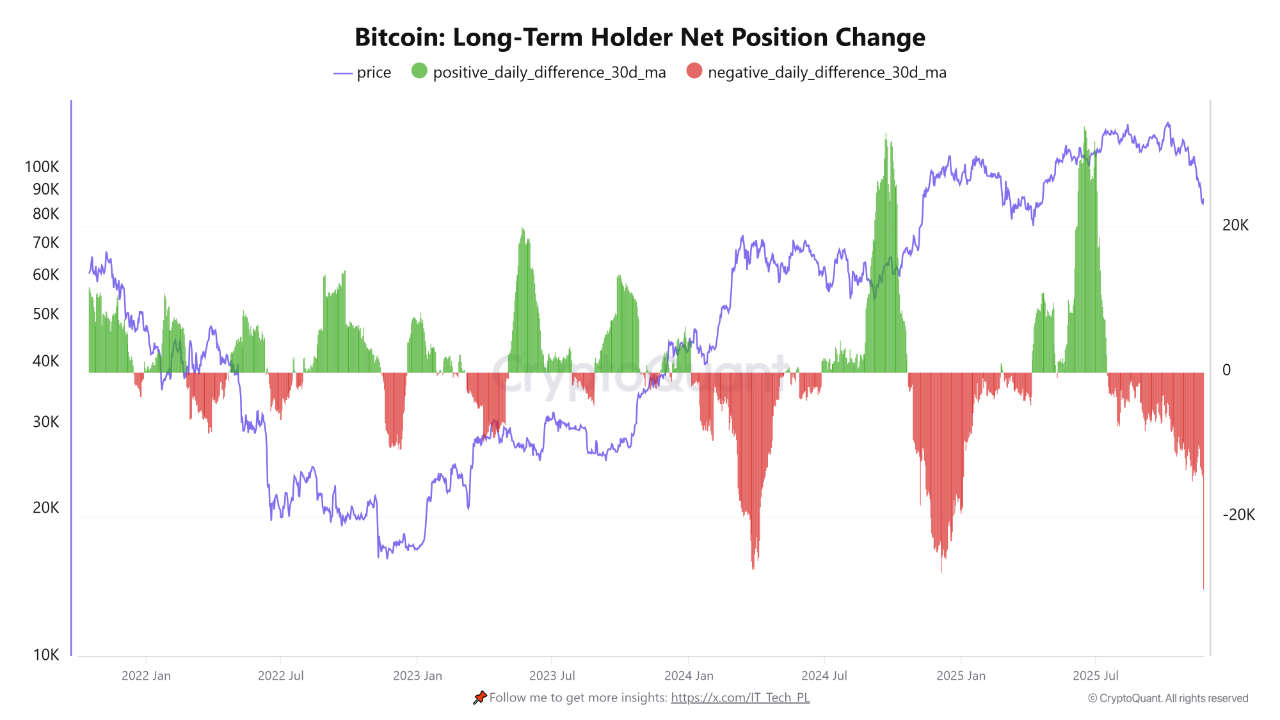
Bitcoin long-term holder net position change | Source: CryptoQuant
At the same time, the chart that tracks short-term holder flows shows that newer buyers are stepping in and absorbing the coins sold by long-term holders. This group often enters the market during fast-moving phases and is currently adding to its positions.
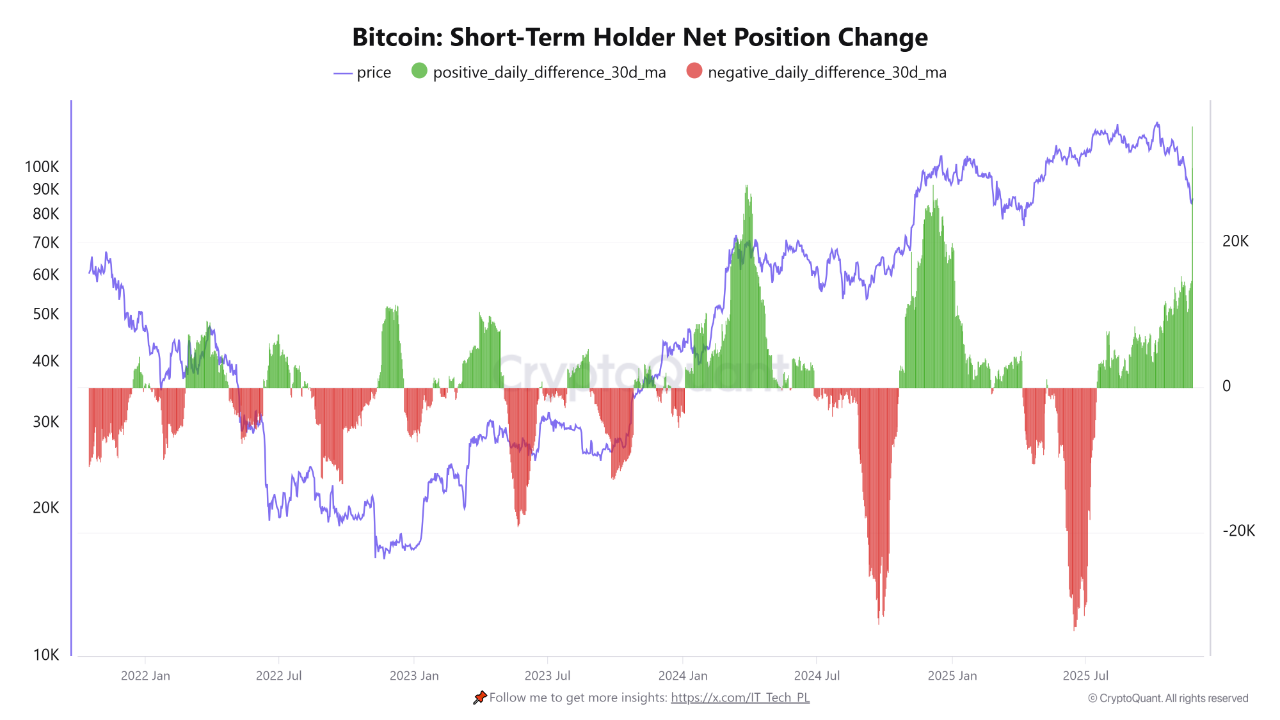
Bitcoin short-term holder net position change | Source: CryptoQuant
According to a CryptoQuant contributor, this setup does not always point to an immediate drop, but it does show a high level of supply hitting the market. If fresh demand does not keep up, traders could face deeper pullbacks or a stretch of sideways movement.
The post Bitcoin ETFs Cement 4 Weeks of Outflows: Next Stage for BTC Is Here appeared first on Coinspeaker.
0
0


 Manage all your crypto, NFT and DeFi from one place
Securely connect the portfolio you’re using to start.

0
0


