Fantom (FTM) Hits Resistance – Can Price Prevent a 20% Drop?
1M ago•

bullish:
0
bearish:
0
Share

Fantom’s (FTM) price action is observing some resistance in its uptrend, with the potential for further decline.
The chances of the cryptocurrency falling by 20% are running since investors aren’t providing much support to FTM.
Fantom Investors Pull Back
Fantom price was doing pretty well for the past month, charting a near 180% increase. However, the last couple of days noted the cryptocurrency declining on the daily chart. While some of this may have to do with the broader market bearish cues, most of it has to do with the FTM holders.
The supply on exchanges noted a sharp uptick in the last 48 hours as the investors moved to sell their holdings. Over 13 million FTM was sold, bringing the total exchange holdings to 657 million FTM.
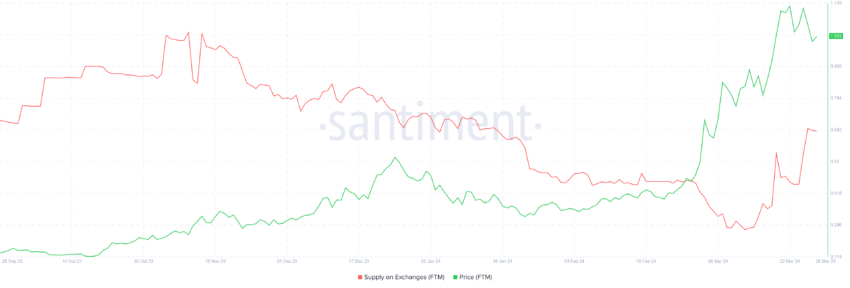 Fantom Supple on Exchanges. Source: Santiment
This is a clear sign of profit-taking, and this will potentially continue since FTM holders will attempt to secure their gains before Fantom price drops.
Read More: Fantom (FTM) Price Prediction 2024/2025/2030
In the scenario where selling is consistent, altcoins’ prices tend to refrain from declining, provided investors’ participation in the on-chain is high. However, this is not the case for Fantom, as the active addresses on the chain have been declining substantially for the past week.
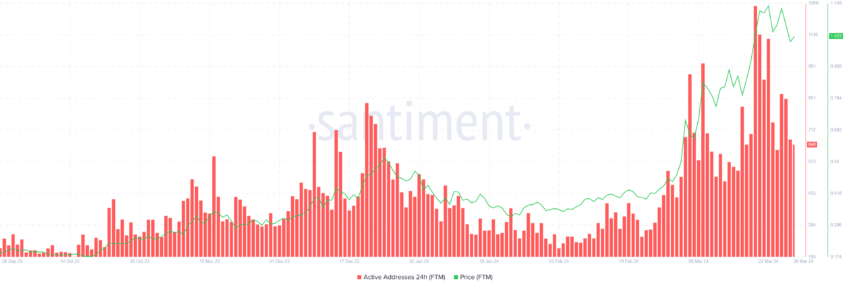 Fantom Active Addresses. Source: Santiment
A reduction in participation imbalances the supply and demand of the asset, which leads to price falls, which is the likely outcome.
FTM Price Prediction: 20% Decline Ahead?
Fantom price, which was observing a parabolic curve pattern, was expected to observe a correction soon. Per the pattern, a 31% decline was likely, as predicted by BeInCrypto, which is the path that FTM chose.
The altcoin failed to breach the resistance of $1.12 and fell through the support of $1.03. However, the decline is not completed yet as Fantom’s price is vulnerable to additional decline. A 20% drop would bring it to the base 3 level marked at $0.80, which is the likely outcome of the pattern.
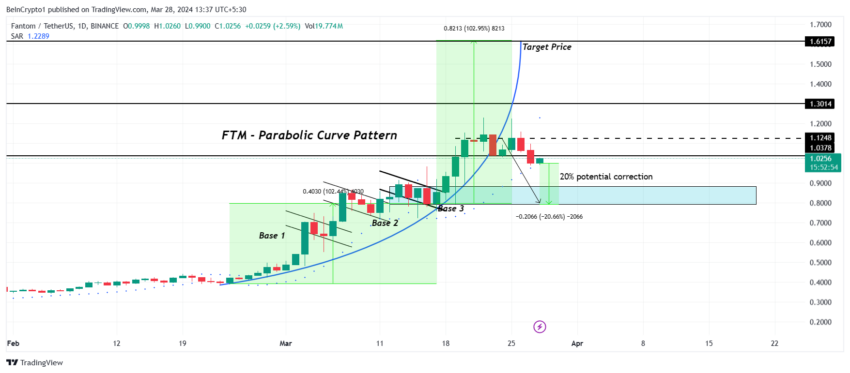 FTM/USDT 1-day chart. Source: TradingView
Read More: 9 Best Fantom (FTM) Wallets in 2024
Nevertheless, since the base 3 support range has been tested as resistance before, the Fantom price could test it as support. Bouncing off the upper limit of the support range at $0.88 would enable FTM to reclaim $1.03 as support. This would invalidate the bearish thesis and allow the cryptocurrency to attempt to breach $1.12 again.
1M ago•
bullish:
0
bearish:
0
Share

 Manage all your crypto, NFT and DeFi from one place
Securely connect the portfolio you’re using to start.

bullish:
0
bearish:
0


