Solana Could Hit $95 If Support Breaks: Market Experts Warn
0
0

The Solana price forecast is drawing significant attention as the token faces a crucial turning point in the market. After a week of strong selling, analysts are watching how Solana’s price moves next.
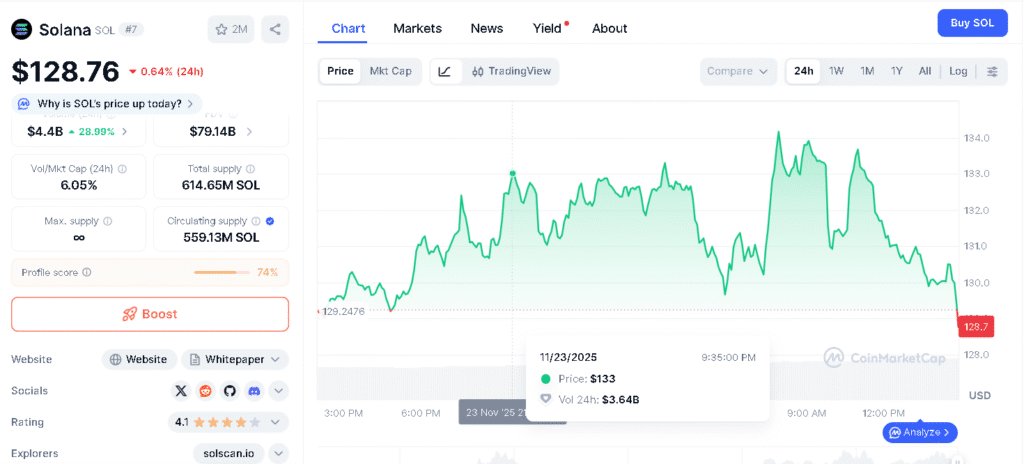
The token is trading near $130.05 as the market looks for some short-term stability. Traders are paying close attention to see whether buyers can take control and push the price up, or if the selling pressure will keep the token under pressure.
What is Solana and why does its structure matter now?
Solana is a blockchain that focuses on speed and low costs. Transactions happen quickly, making it practical for real-time applications. Its system uses a mix of methods to keep things secure, and it is often compared to other networks built to handle heavy workloads.
Many developers and traders watch Solana closely because it can process large volumes without slowing down. The chain has gone through major cycles before, but specialists note that its long-term behavior often reflects shifts in broader liquidity.
This is why many traders are linking the current support test directly to the latest solana price forecast discussions across the market.
Is the coming death cross reshaping the market narrative?
Yes. Charts show Solana moving inside a steep falling channel that started in mid-September. A series of lower highs and repeated setbacks at the channel’s midpoint show that bearish sentiment has stayed strong for months.

A senior analyst at a digital-asset desk said that when the 50-day and 200-day moving averages cross, it often shows that the asset might move sideways for a longer time, especially if it is already going down.
The Solana price forecast shows that the $121 to $123 area is an important support level. If it doesn’t hold, the price could fall further to $107 or even $95.
Is support holding or weakening at the lower boundary?
Support around $121 is holding for now, but it isn’t very strong. The price has dipped to this area a few times, and buyers have stepped in each time. The RSI has started to rise from low levels, giving a small sign that selling may be slowing.
So far, every try to push the price higher has stopped just below the middle of the channel, and analysts say momentum is still weak. The latest Solana price forecast notes that buyers need to reclaim the $144 to $146 range before any short-term trend can change.
| Metric/Indicator | Key Value |
|---|---|
| Current Trading Price | ~$130.05 |
| Critical Support Zone | $121 to $123 |
| Immediate Downside Targets | $107, $95 |
| Resistance Zone for Recovery | $144 to $146 |
| Higher Resistance Targets | $172, $205 |
| Technical Chart Pattern | Falling Channel |
| Death Cross Indicator | 50-day MA crosses below 200-day MA |
| RSI Indicator | Rising from lows |
| Short-Term Sentiment | Bearish |
| Short-Term Price Forecast | ~$126 within a week |
| One-Month Price Outlook | ~ $127.89 |
| 3-Month Forecast | ~$172 |
| Market Sentiment Drivers | Institutional inflows, liquidity shifts |
What levels define the next phase of market direction?
Traders watching momentum say the path is clear. Traders say that holding above $144 would be a first sign that Solana is trying to recover, and it could open the way toward $146, $172, and possibly $205 if the market mood improves.

On the other hand, falling below $121 at the close of the day would give the death-cross setup more weight and could push the price lower as December begins. Some analysts warn that this development could change the short-term Solana price forecast and potentially lead to a larger drop as we head into early December.
Some portfolio managers say that if broader market conditions ease, Solana could enter a period of accumulation, creating opportunities for investors who want to hold it for the long-term.
Conclusion
The Solana price forecast shows that uncertainty is still high. The token is managing to stay above its support zone, but the falling channel and the approaching crossover maintain a cautious, bearish outlook. One trader described the chart as sitting in a fine line between strength and risk.
The next few sessions will show whether the solana price forecast moves toward a recovery or drops further. What is clear is that the $121 to $123 range has become the key area to watch.
For now, institutions, retail traders, and on-chain analysts are all focused on the same question. Can support hold, or will the market move into a new downward phase? Either way, the Solana price forecast will be shaped by whatever happens next.
Glossary
Death Cross: A bearish chart signal that happens when the 50-day moving average moves below the 200-day moving average.
Moving Average :A line that shows the average price over a set number of days to help understand the market trend.
Falling Channel: A chart pattern where the price keeps moving down between two slanted lines.
Bearish Trend: A downward price movement that shows sellers are in control.
Frequently Asked Questions About Solana Price Forecast
What price level is Solana trading near?
Solana is trading close $130. As market waits for some stability.
What is causing concern on the Solana’s price chart?
Because the price keeps dropping and making lower highs. It shows sellers are strong
Why does death cross matter for Solana now?
Death cross matters alot. Because it signals that Solana may stay weak or move sideways for a longer time.
What support level is important for Solana?
The key support area for Solana lies between $121 and $123.
What happens if Solana breaks below this support?
If Solana falls below this support, price could drop further toward $107 or even $95
Sources
Read More: Solana Could Hit $95 If Support Breaks: Market Experts Warn">Solana Could Hit $95 If Support Breaks: Market Experts Warn
0
0
 Manage all your crypto, NFT and DeFi from one place
Securely connect the portfolio you’re using to start.


