GALA Price Rally Above Resistance Could Fail Due to Low Demand
14d ago•

bullish:
0
bearish:
0
Share

GALA has bounced off the lower line of its descending triangle and is poised for an upside breakout.
However, readings from the token’s three-day chart showed that the current uptrend may be short-lived.
Gala Bulls Have a Challenge Ahead
GALA currently trades at $0.0437. Its value has risen by almost 5% in the last week, causing it to trade above a long-term support level of $0.03.
However, the decline in the altcoin’s network activity has shown that its price growth in the last week merely mirrors the uptrend in the general cryptocurrency market during that period. GALA’s price growth has not been backed by any significant demand from its traders.
An assessment of the token’s whale activity confirmed this. Since May 16, the market has not seen any significant count of GALA transactions exceeding $100,000 or $1 million.
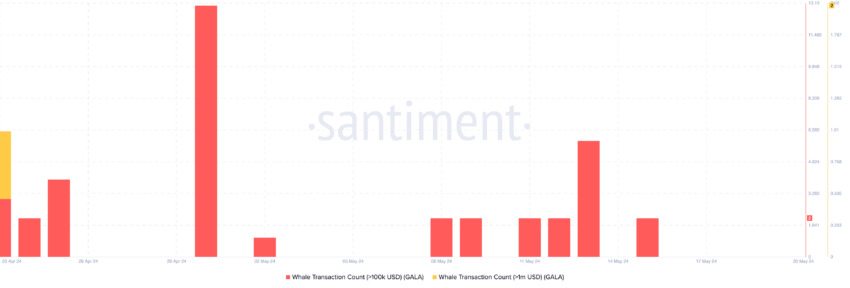 Gala Whale Transaction Count. Source: Santiment
Generally, the absence of large whale transactions is interpreted as a lack of confidence or interest from major investors. This can affect an asset’s general market sentiment.
This has played out in GALA’s case. As of this writing, the token’s Weighted Sentiment returns a negative value of -0.707.
Read More: How to Buy Gala (GALA) and Everything You Need to Know
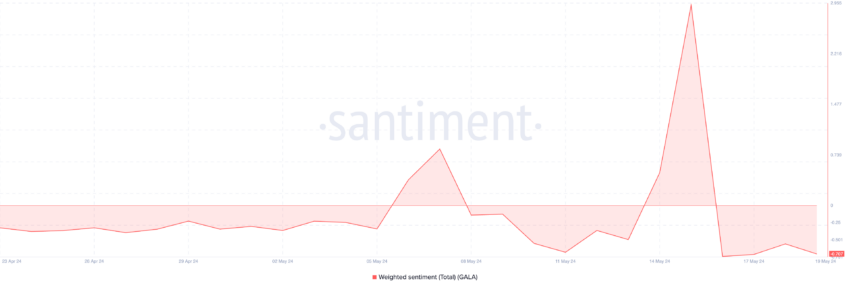 Gala Weighted Sentiment. Source: Santiment
It is key to note that this metric began falling below zero on May 16, when the number of large transactions started to fall.
GALA Price Prediction: Why a Decline is More Likely
GALA’s Chaikin Money Flow (CMF) has trended downward despite its price rally in the last week. Currently below the zero line at -0.14, the negative value of the token’s CMF indicator has led to the formation of a bearish divergence.
A CMF bearish divergence is formed when an asset’s price rallies while the indicator trends in the opposite direction. When this happens, it suggests that, despite rising prices, buying pressure is weakening. Traders often view it as a signal of a potential price reversal to the downside.
Also, the dots of GALA’s Parabolic SAR indicator rest above its price as of this writing. This indicator identifies potential trend directions and reversals in an asset’s price movements.
When its dots lie above an asset’s price, it is a bearish sign. It suggests that the market is in decline, and prices may continue to fall.
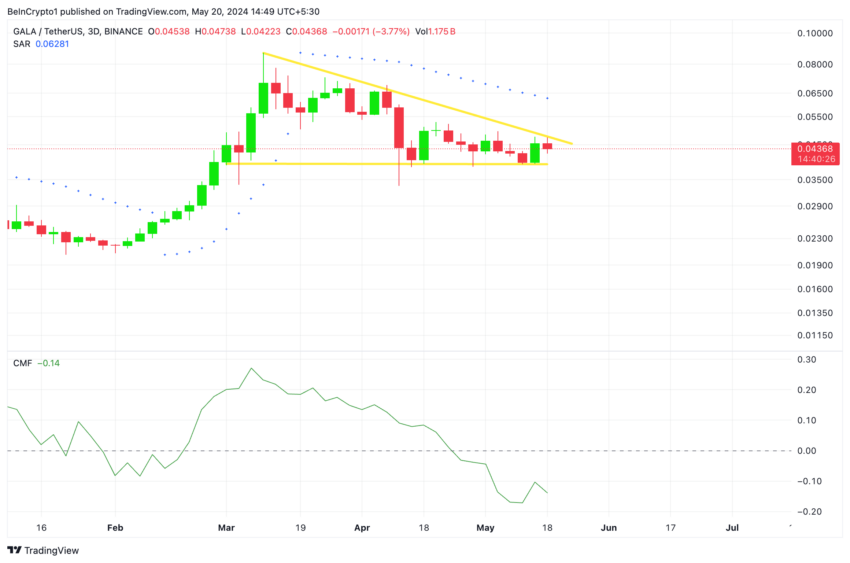 Gala Price Analysis. Source: TradingView
If GALA’s price fails to rally above the upper line of the descending triangle and initiates a decline, the altcoin’s value might dip below $0.04 to exchange hands below support at $0.03.
Read More: Gala (GALA) Price Prediction 2024/2025/2030
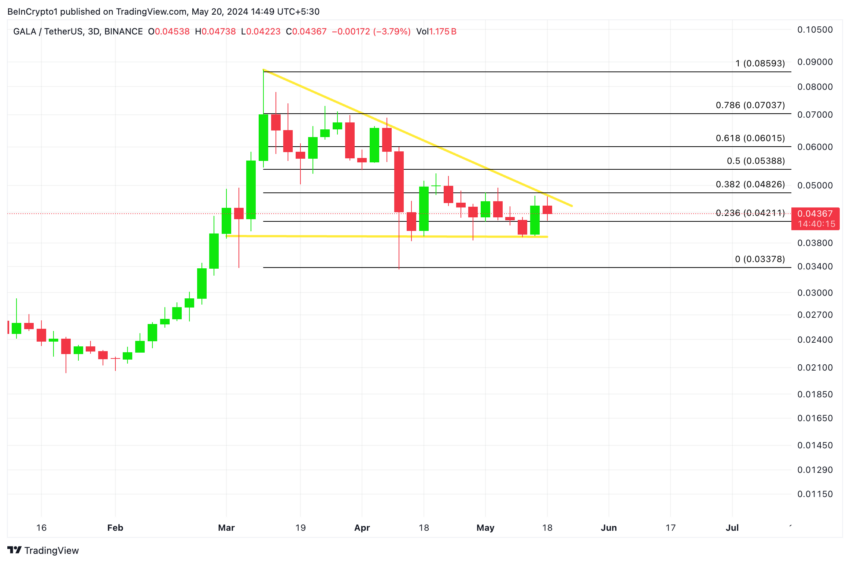 Gala Price Analysis. Source: TradingView
However, if demand begins to trickle in and sentiment changes to positive, the bulls may be able to push the token’s price above resistance and toward $0.053.
14d ago•
bullish:
0
bearish:
0
Share


 Manage all your crypto, NFT and DeFi from one place
Securely connect the portfolio you’re using to start.

bullish:
0
bearish:
0


bullish:
0
bearish:
0