Daily Market Review: BTC, ETH, BONK, RNDR, XEC
14d ago•

bullish:
0
bearish:
0
Share

Today’s market session has seen bulls loose out to bears as evidenced by the drop in the global market cap. The total cap stood at $2.43T as of press time, representing a 0.24% drop over the last 24 hours while the trading volume stood a $47.15B, a 28.5% decrease over the last 24 hours.
Bitcoin Price Review
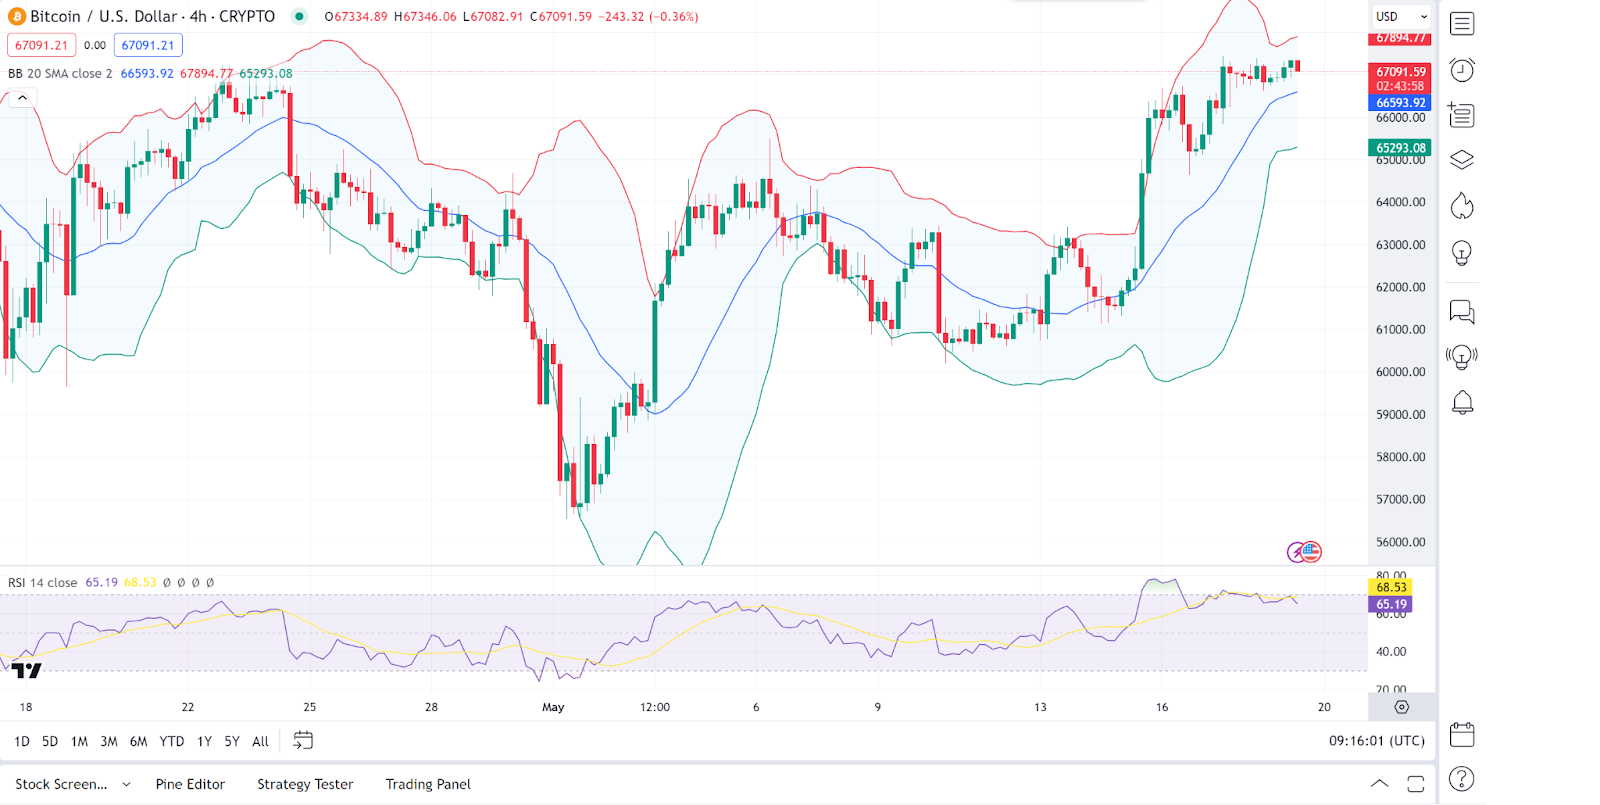
Bitcoin (BTC) is facing consolidations after its recent pump, evidenced by its price movements. Looking at an in-depth analysis, we see that the Bitcoin price is trading near the upper band, indicating a potential overbought condition. The bands are widening, suggesting increased volatility.
On the other hand, the RSI (Relative Strength Index): RSI is at 65.19, approaching the overbought territory (>70). This indicates that the buying pressure is high but might be nearing an overbought condition. As of press time, the Bitcoin price stood at $67,031, a 0.12% increase from its previous 24-hour price.
Ethereum Price Review
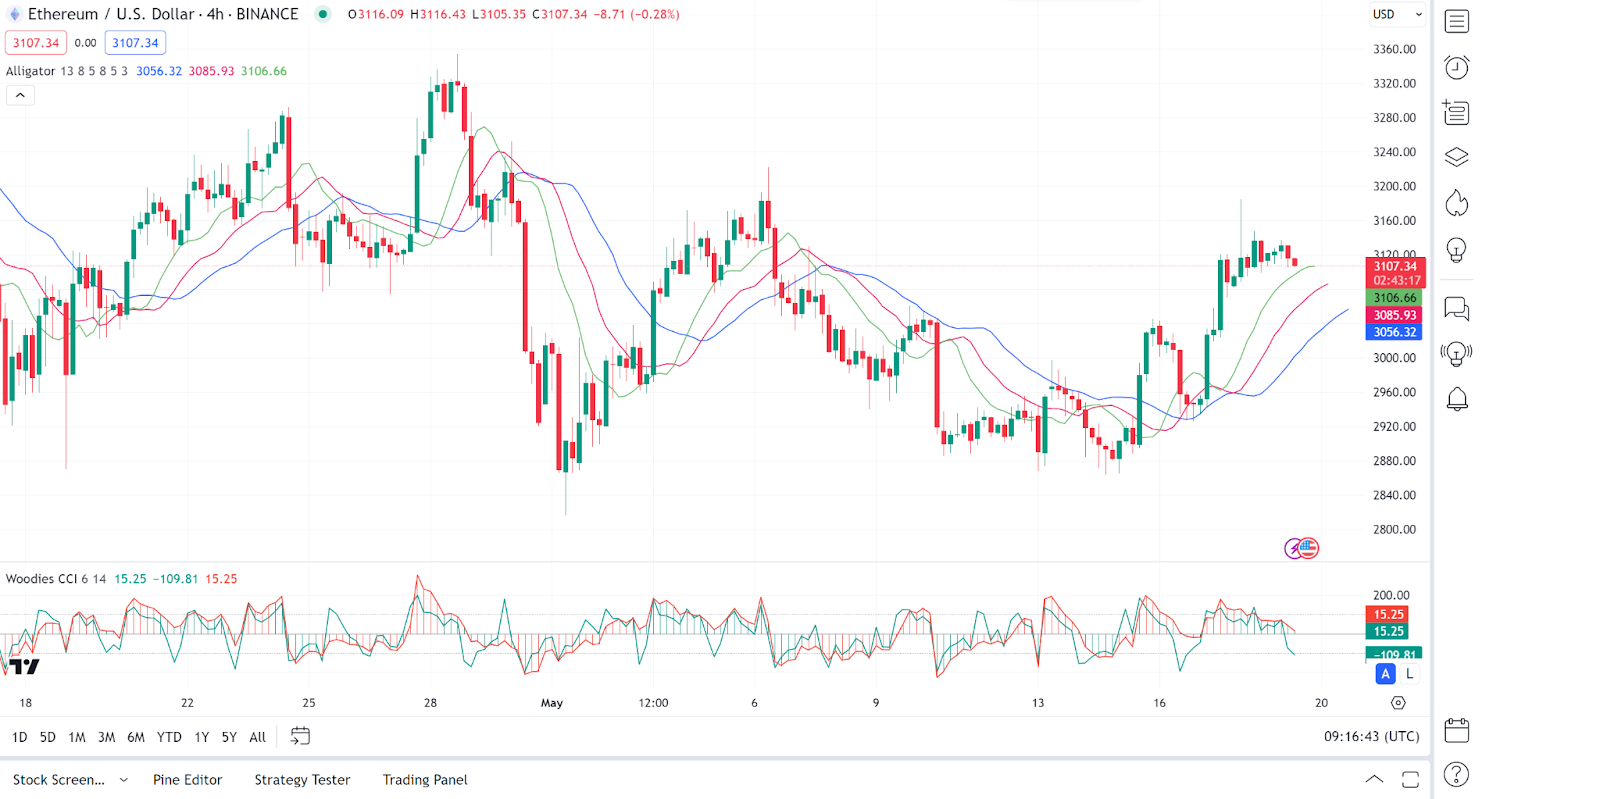
Ethereum (ETH) is now correcting slightly after its recent pump as evidenced by its price movements in today’s session. Looking at an in-depth analysis, we see that the green, red, and blue lines of the Alligator indicator are in a bullish alignment with the green line above the red and blue lines, indicating a continuing uptrend.
On the other hand, the Woodies CCI is at 15.25, which is in the neutral zone. A value above 100 would indicate an overbought condition, while below -100 would indicate an oversold condition. As of press time, the Ethereum price stood at $3,103, a 0.49% decrease from its previous 24-hour price.
Bonk Price Review
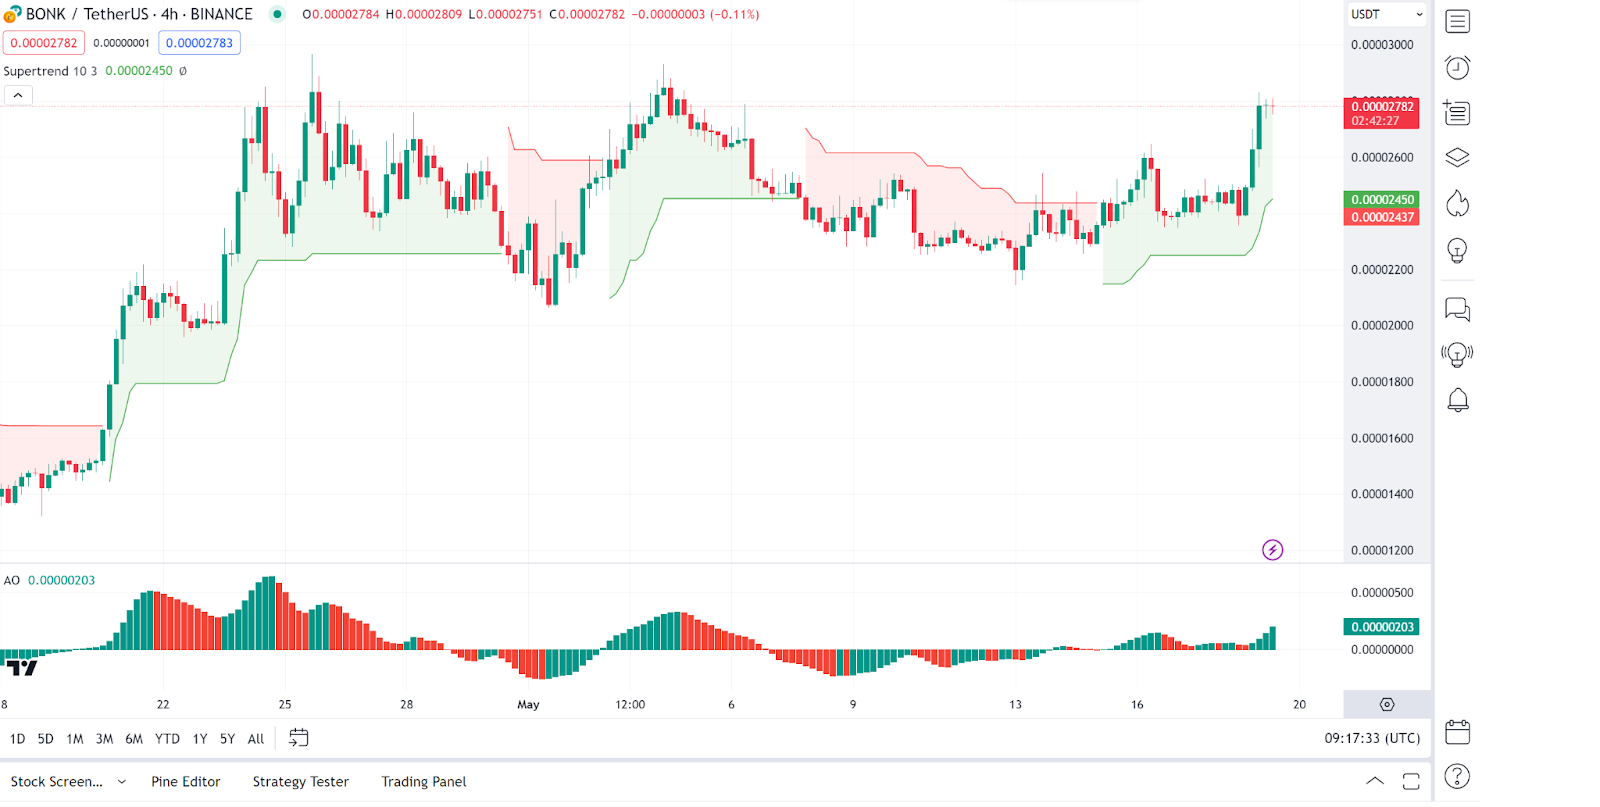
Bonk (BONK) is today’s top gainer as evidenced by its price movements in today’s session. Looking at an in-depth analysis we see that the Supertrend indicator is currently showing a buy signal as the price is above the green line of $0.00002450.
On the other hand, we see that the awesome Oscillator (AO) shows green bars, indicating bullish momentum. As of press time, the Bonk price stood at $0.00002765, a 12.36% increase from its previous 24-hour price.
Render Price Review
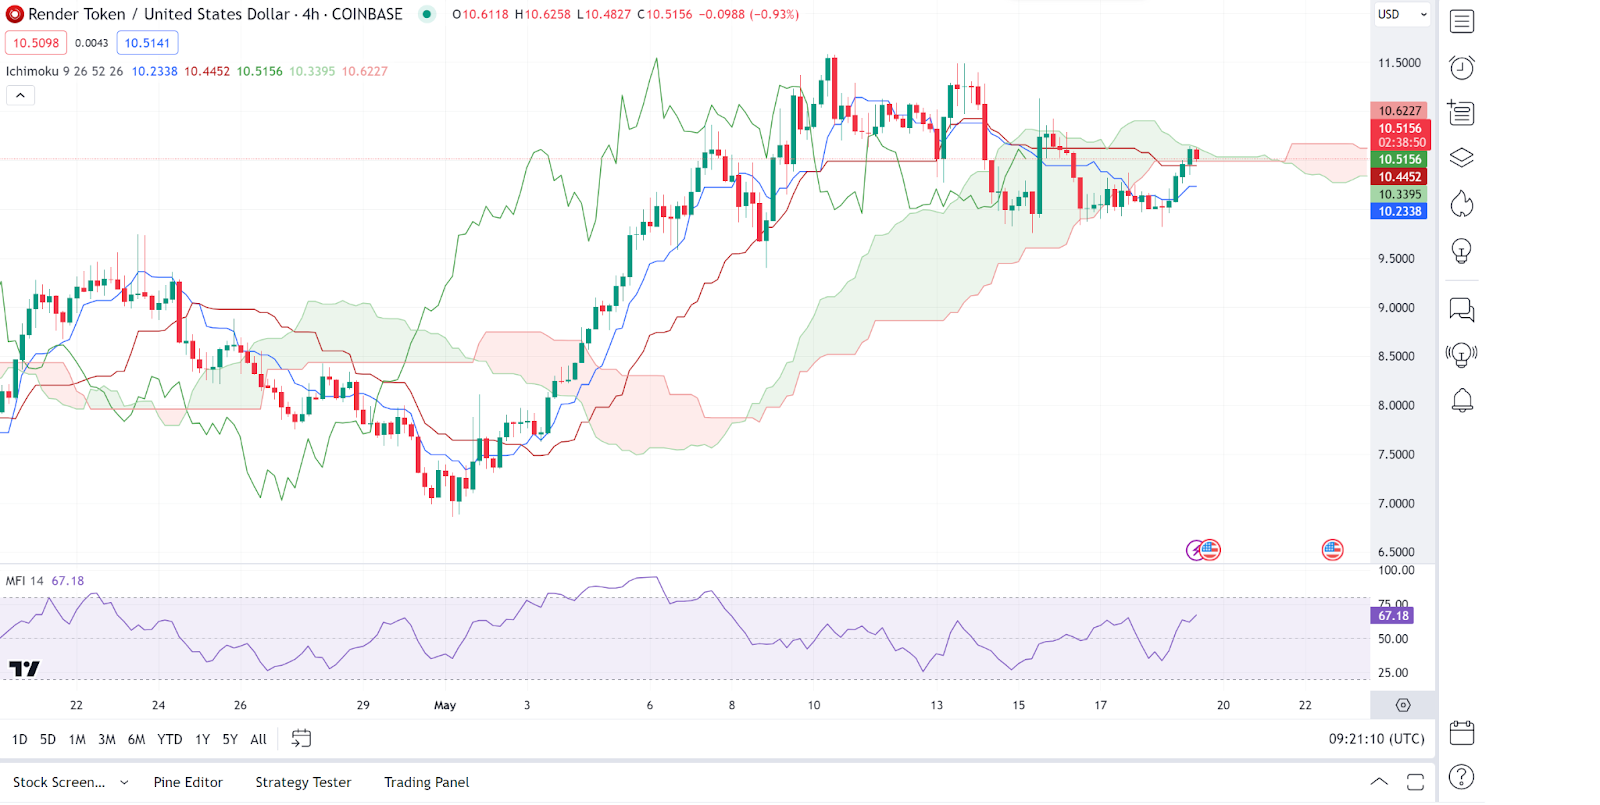
Render (RNDR) was also another gainer in today’s session, as seen from its price movements. In-depth analysis shows that the Render price is above the cloud, indicating a bullish trend. Leading Span A (10.5156) and Leading Span B (10.2338) provide support levels.
On the other hand, the MFI (Money Flow Index) is at 67.18, approaching overbought levels (>80). As of press time, the Render price stood at $10.51, a 4.26% increase from its previous 24-hour price.
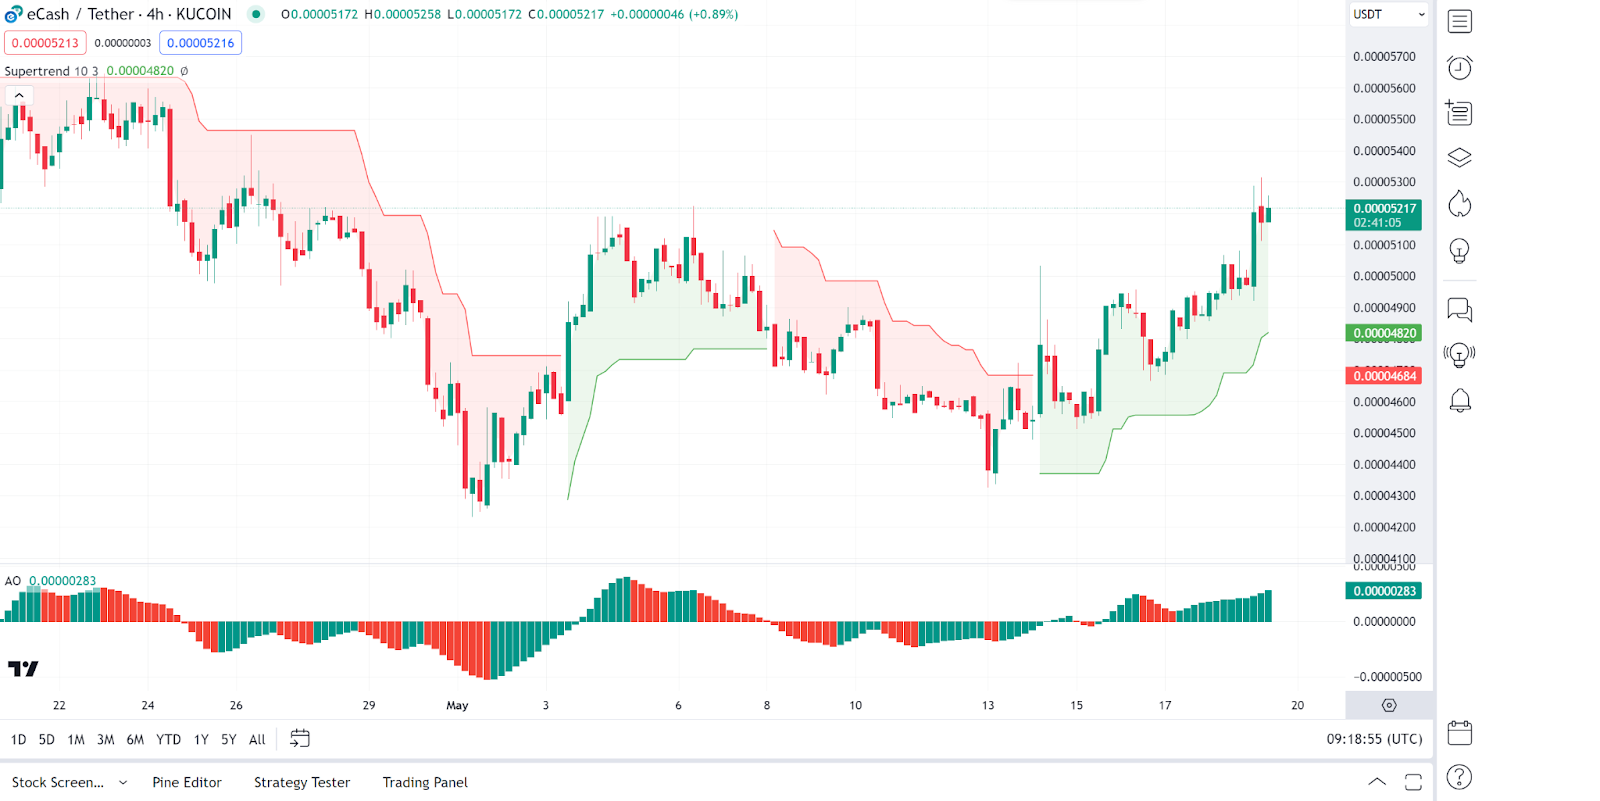
eCash Price Review
eCash (XEC) is also among the gainers in today’s session as evidenced by its price movements. An in-depth analysis shows that the Supertrend indicator shows a buy signal with the price above the green line of $0.00004820.
On the other hand, the Awesome Oscillator (AO) displays green bars, indicating bullish momentum. As of press time, the eCash price stood at $0.00005172, a 4.3% increase from its previous 24-hour price.
14d ago•
bullish:
0
bearish:
0
Share

 Manage all your crypto, NFT and DeFi from one place
Securely connect the portfolio you’re using to start.

bullish:
0
bearish:
0


bullish:
0
bearish:
0

bullish:
0
bearish:
0