Polkadot's DOT Slips 4% From Highs, Now Testing Support at $3.32 Level
9h ago•

bullish:
0
bearish:
0
Share
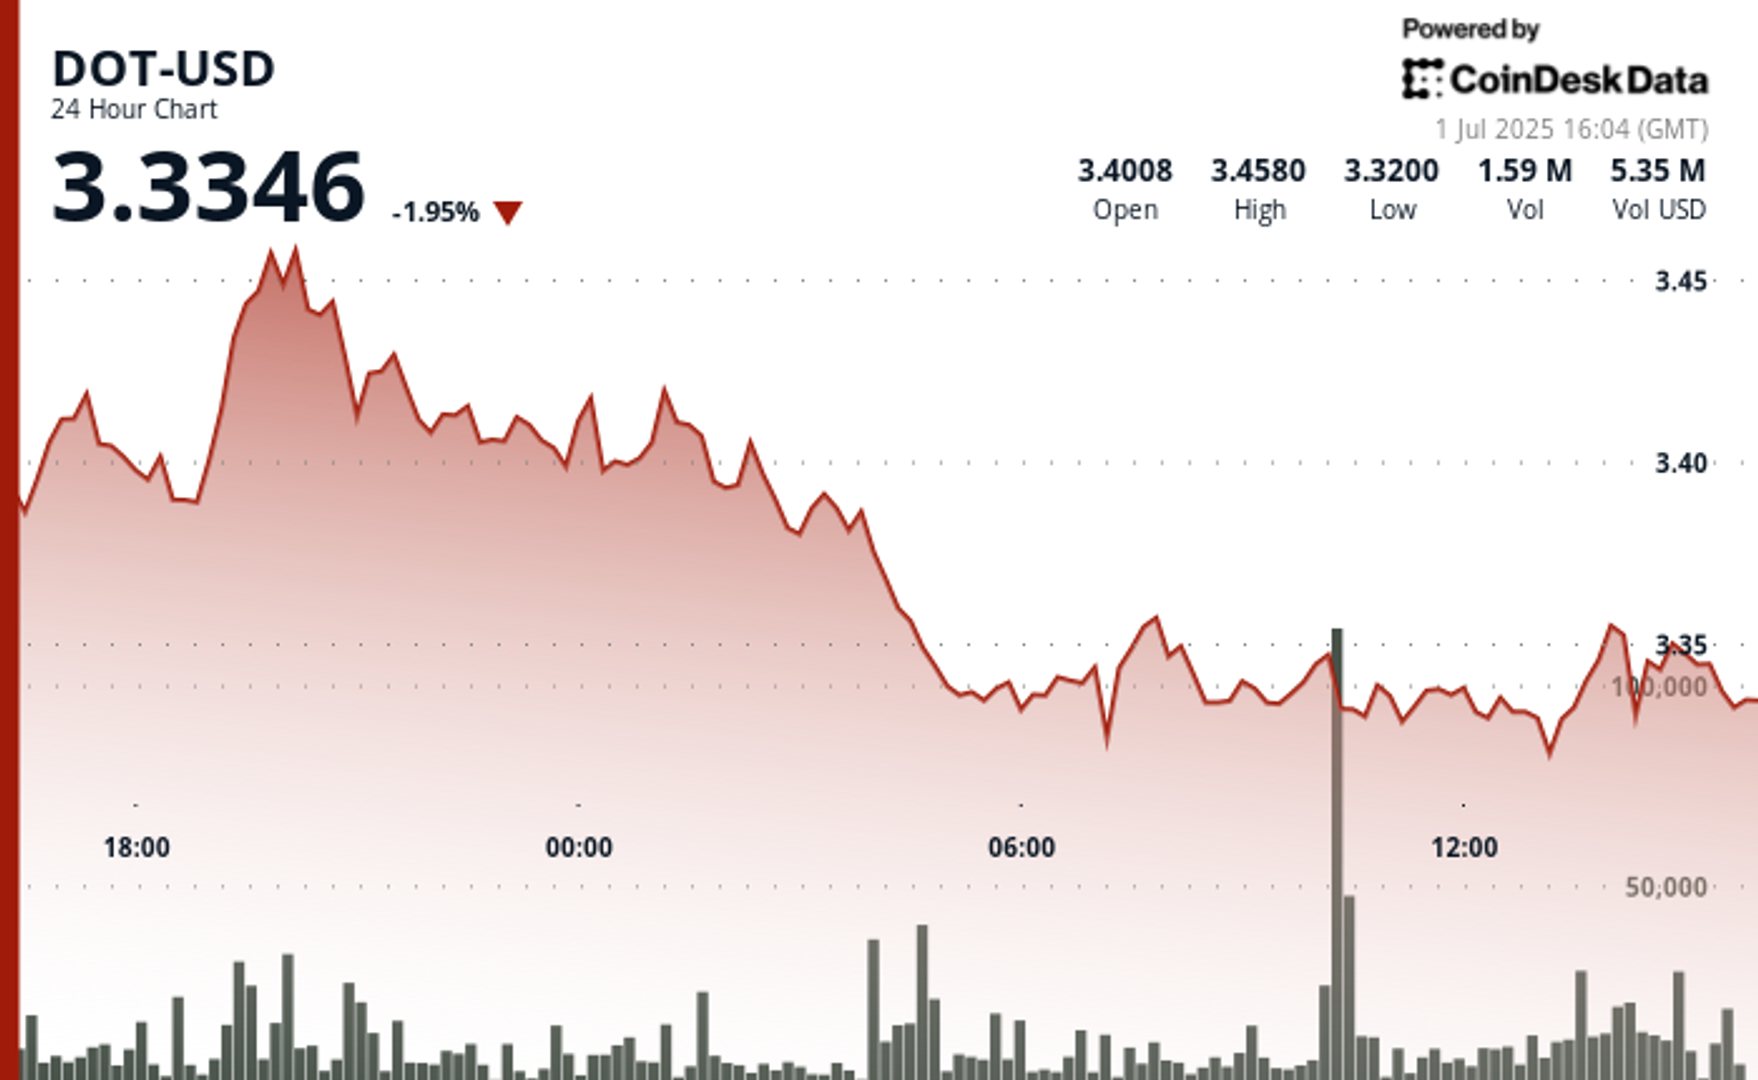
Polkadot's DOT showed a clear trading range of 4.4%, with price action characterized by a sharp rally to $3.46 followed by a substantial correction, according to CoinDesk Research's technical analysis model.
The model showed that support has now formed at the $3.32 level, which is currently being tested.
The Polkadot ecosystem suffered a notable slowdown in transaction activity in the first quarter of the year, with a 36.9% drop from the previous quarter to 137.1 million transactions.
In recent trading, DOT was 2.4% lower over 24 hours at around $3.31. The broader market gauge, the CoinDesk 20, was 2.4% lower at publication time.
Technical Analysis:
- The 19:00-20:00 timeframe on June 30 saw the strongest bullish momentum with above-average volume (1.81M), establishing resistance at $3.46.
- Support formed at $3.32 during the July 1 07:00 hour with high volume (1.34M).
- The final hours showed renewed selling pressure, with DOT closing near the lower end of its range at $3.33, suggesting bearish sentiment despite a brief recovery attempt during the 14:00 hour.
- The period was marked by a sharp rally to $3.36 at 15:06, establishing the hour's high, followed by a steep sell-off that accelerated after 15:36.
- Notable volume spikes occurred at 15:31-15:32 (267K combined), suggesting institutional selling pressure.
9h ago•
bullish:
0
bearish:
0
Share

 Manage all your crypto, NFT and DeFi from one place
Securely connect the portfolio you’re using to start.


